Overview
Since 2016, recipients of General Operating Support (GOS) Grants have been asked to complete a report with information about key indicators. This helps staff, members of the Arts Commission, and City Council understand the impact of the Cultural Grants Program on Boulder’s community, both economically and culturally.
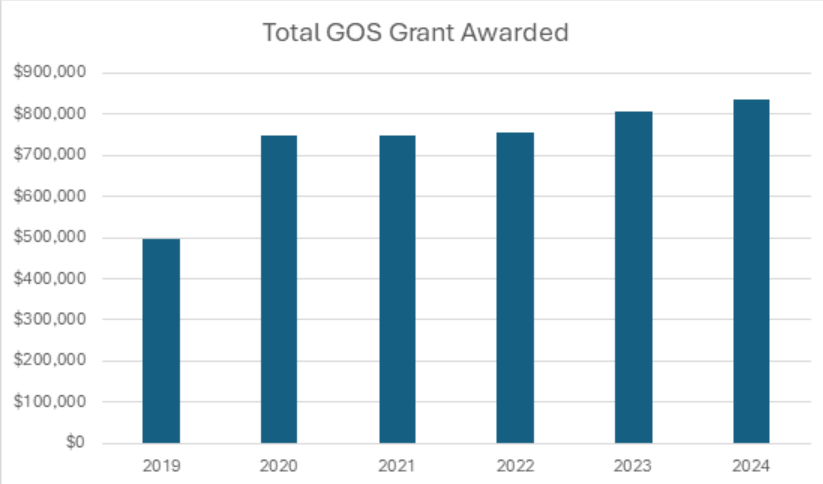
In 2024, $835,988 of General Operating Support was distributed to 42 organizations. grants were provided in amounts that range between $8,000 to $50,000 depending on the size of the organization’s budget. Boulder Arts Commission GOS funding comprised the following percentages of arts organizations’ budgets on average: 11% for small, 3% for medium, 3% for large, and 2% for extra-large.
Audience Trends
The General Operating Support (GOS) Grants survey provides data regarding funded organizations’ programming and audiences. Combined with Boulder-specific data from Americans for the Arts’ Arts & Economic Prosperity 6 (AEP6) economic and social impact study, insights emerge concerning audience trends and areas for further growth.
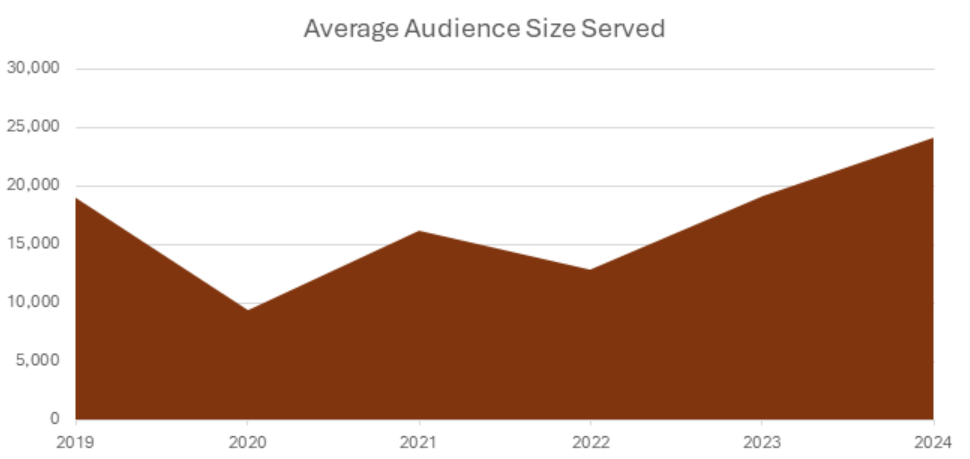
By 2024, audience sizes surpassed pre-COVID levels. Now, organizations can start to question what non-pandemic factors are influencing their audience composition, attendance frequency, and overall size.
Locals vs. Visitors
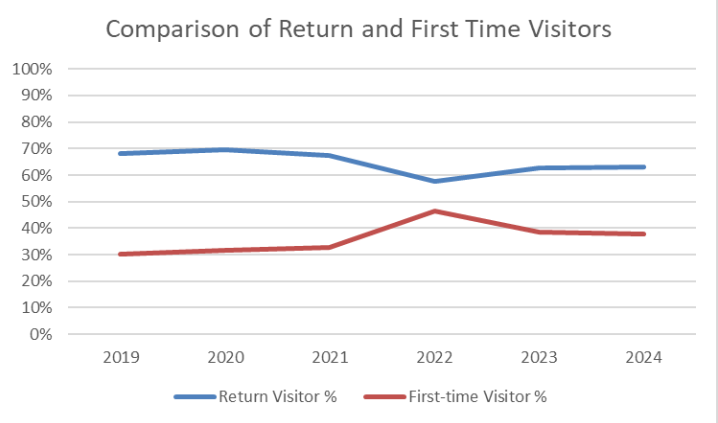
The percentage of attendees that are local has remained stable, with a slight decline since 2020. Conversely, the percentage of non-local attendees is slowly increasing. Organizations may want to devote resources to retain and grow their local audience, especially as the return rate of attendees is slowly decreasing.
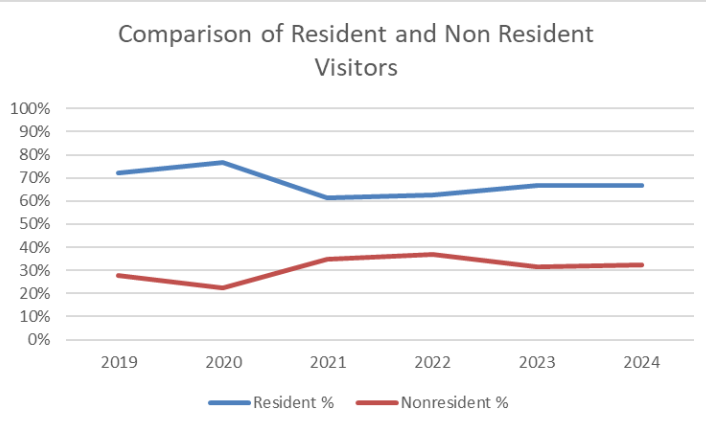
According to the AEP6, the majority of Boulder’s arts and culture event attendees (64%) are locals. This is confirmed by the 2024 GOS Survey (67%). When local attendees were asked what they would have done if the event where they were surveyed had not been available, 55% of attendees who live in Boulder County said they would have “traveled to a different community to attend a similar arts or cultural activity”. After assessing where there may be programmatic gaps locally, a compelling argument may need to be made as to why Boulder’s programmatic offerings are robust and can compete with those in other municipalities.
In the City of Boulder, 36% of attendees are non-local visitors who traveled from outside Boulder County; they spend an average of $46.97. Additionally, 87.9% of non-local attendees reported that the primary purpose of their visit was specifically to attend the performance, event, exhibit, venue, or facility where they were surveyed.
Ticket Prices
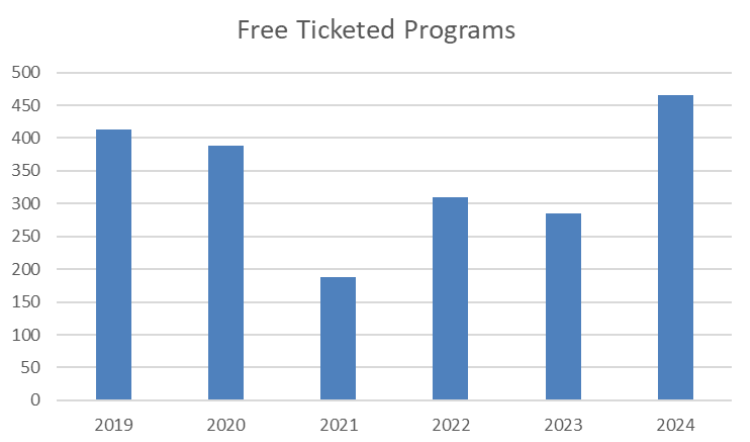
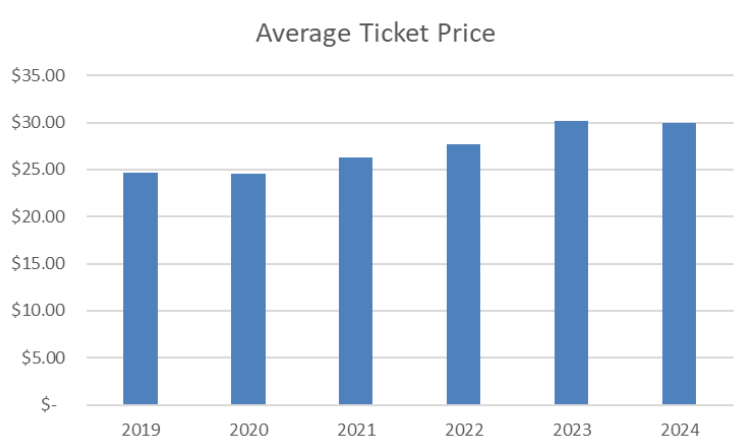
In the past five years, the average ticket price has increased by $5, averaging $30 per ticketed event in 2024. This is below the rate of inflation ($25 dollars in 2019 would be worth $32 in 2025). The number of free programs has increased. It is unclear whether increased ticket prices or availability are keeping audiences from returning. Perhaps attendees need to prioritize other expenses, or factors like marketing and outreach could be strengthened.
Economic Analysis
Event-related spending by arts and culture audiences totaled $61.6 million according to the most recent data (AEP6). This figure reflects a broader economic impact than ticket prices alone. When people attend a cultural event, they often make an outing of it - dining at a restaurant, paying for parking or public transportation, enjoying dessert after the show, and returning home to pay for child or pet care. Overall, in the City of Boulder, attendees spend $33.28 per person per event, beyond the cost of admission. These dollars represent vital income for local merchants and a value-add with which few industries can compete.
A note on methodology: the questionnaire captures general measures and averages. This does not always work the same for every discipline and every type of organization; there is variety in the criteria gathered when evaluating an organization. The data relies on each organization to make some judgments and provide the most accurate information possible.