2024-2025 Statistical Report

Prepared by Bauman Consulting Group for The City of Boulder, December 23, 2025.

Executive Summary

The City of Boulder’s Community Assistance Response and Engagement (CARE) program was launched to provide a non-police response to low-acuity behavioral health, human service and medical calls that did not present with safety concerns. CARE paired a licensed behavioral health clinician with a dedicated paramedic to respond to selected 911 calls where no violence, weapons or criminal activity were involved. The goal was to resolve crises safely in the community, reduce reliance on law enforcement and connect residents to care.

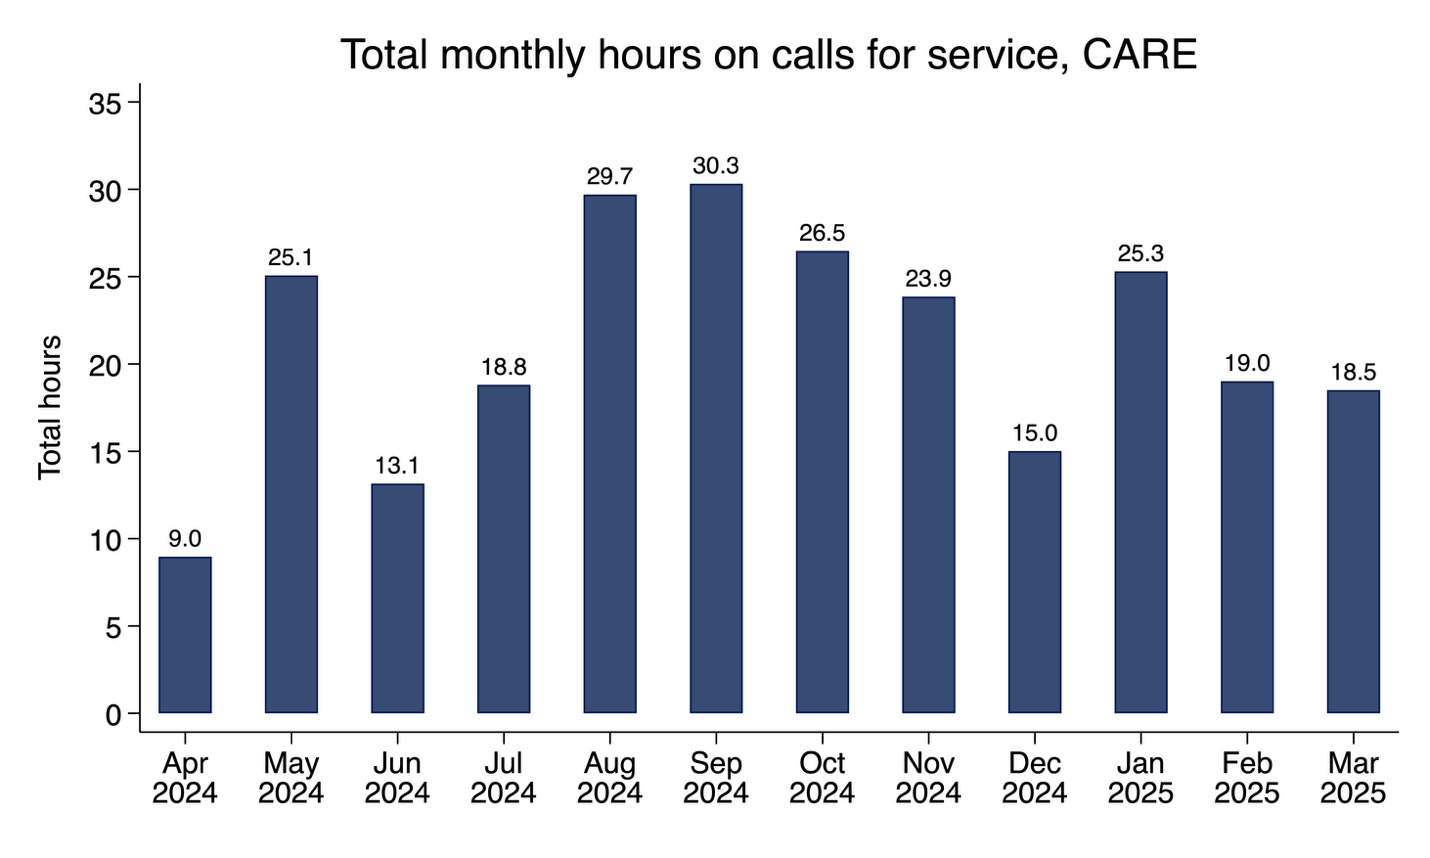
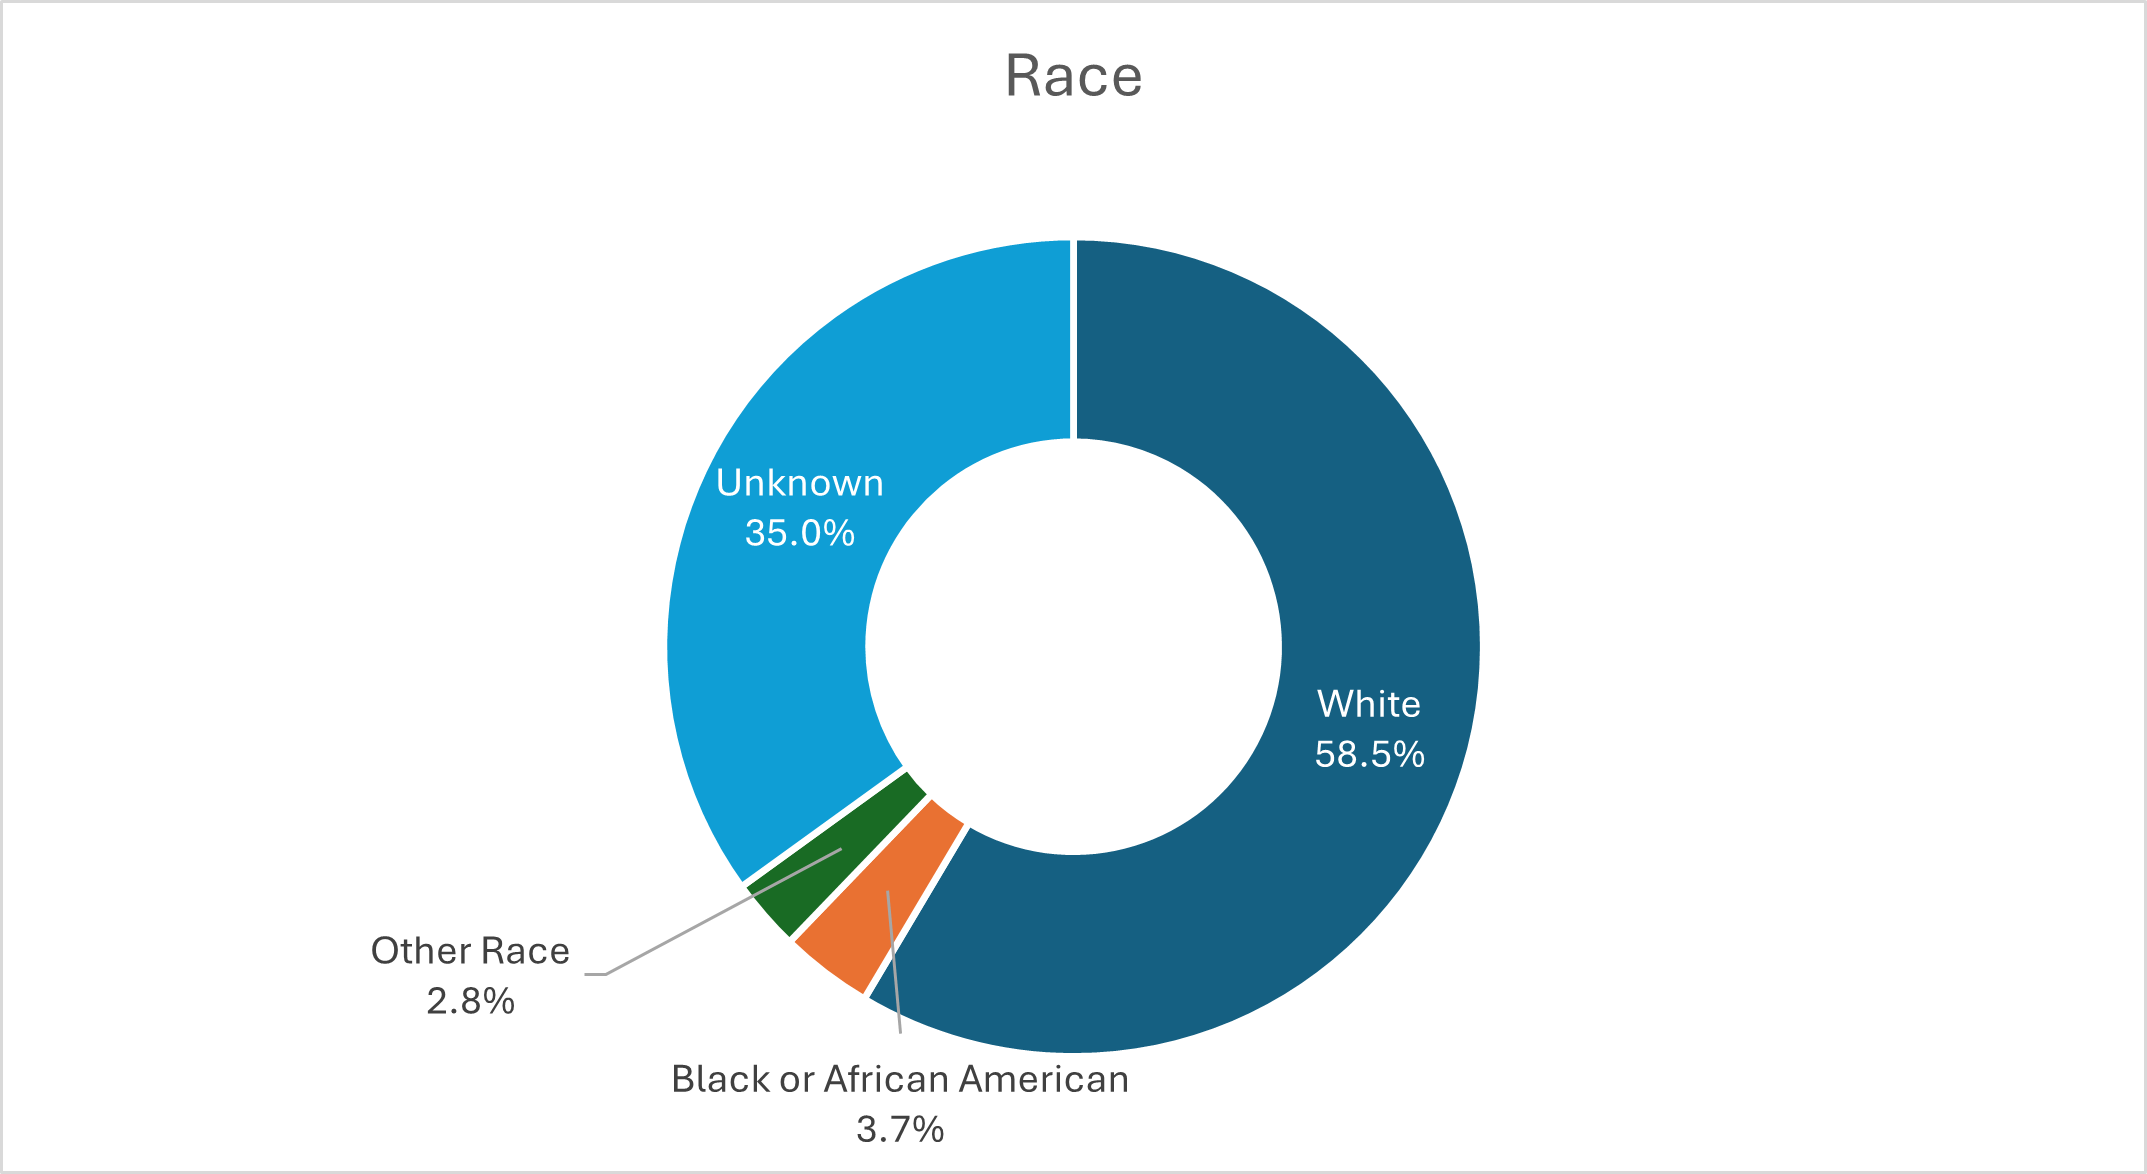
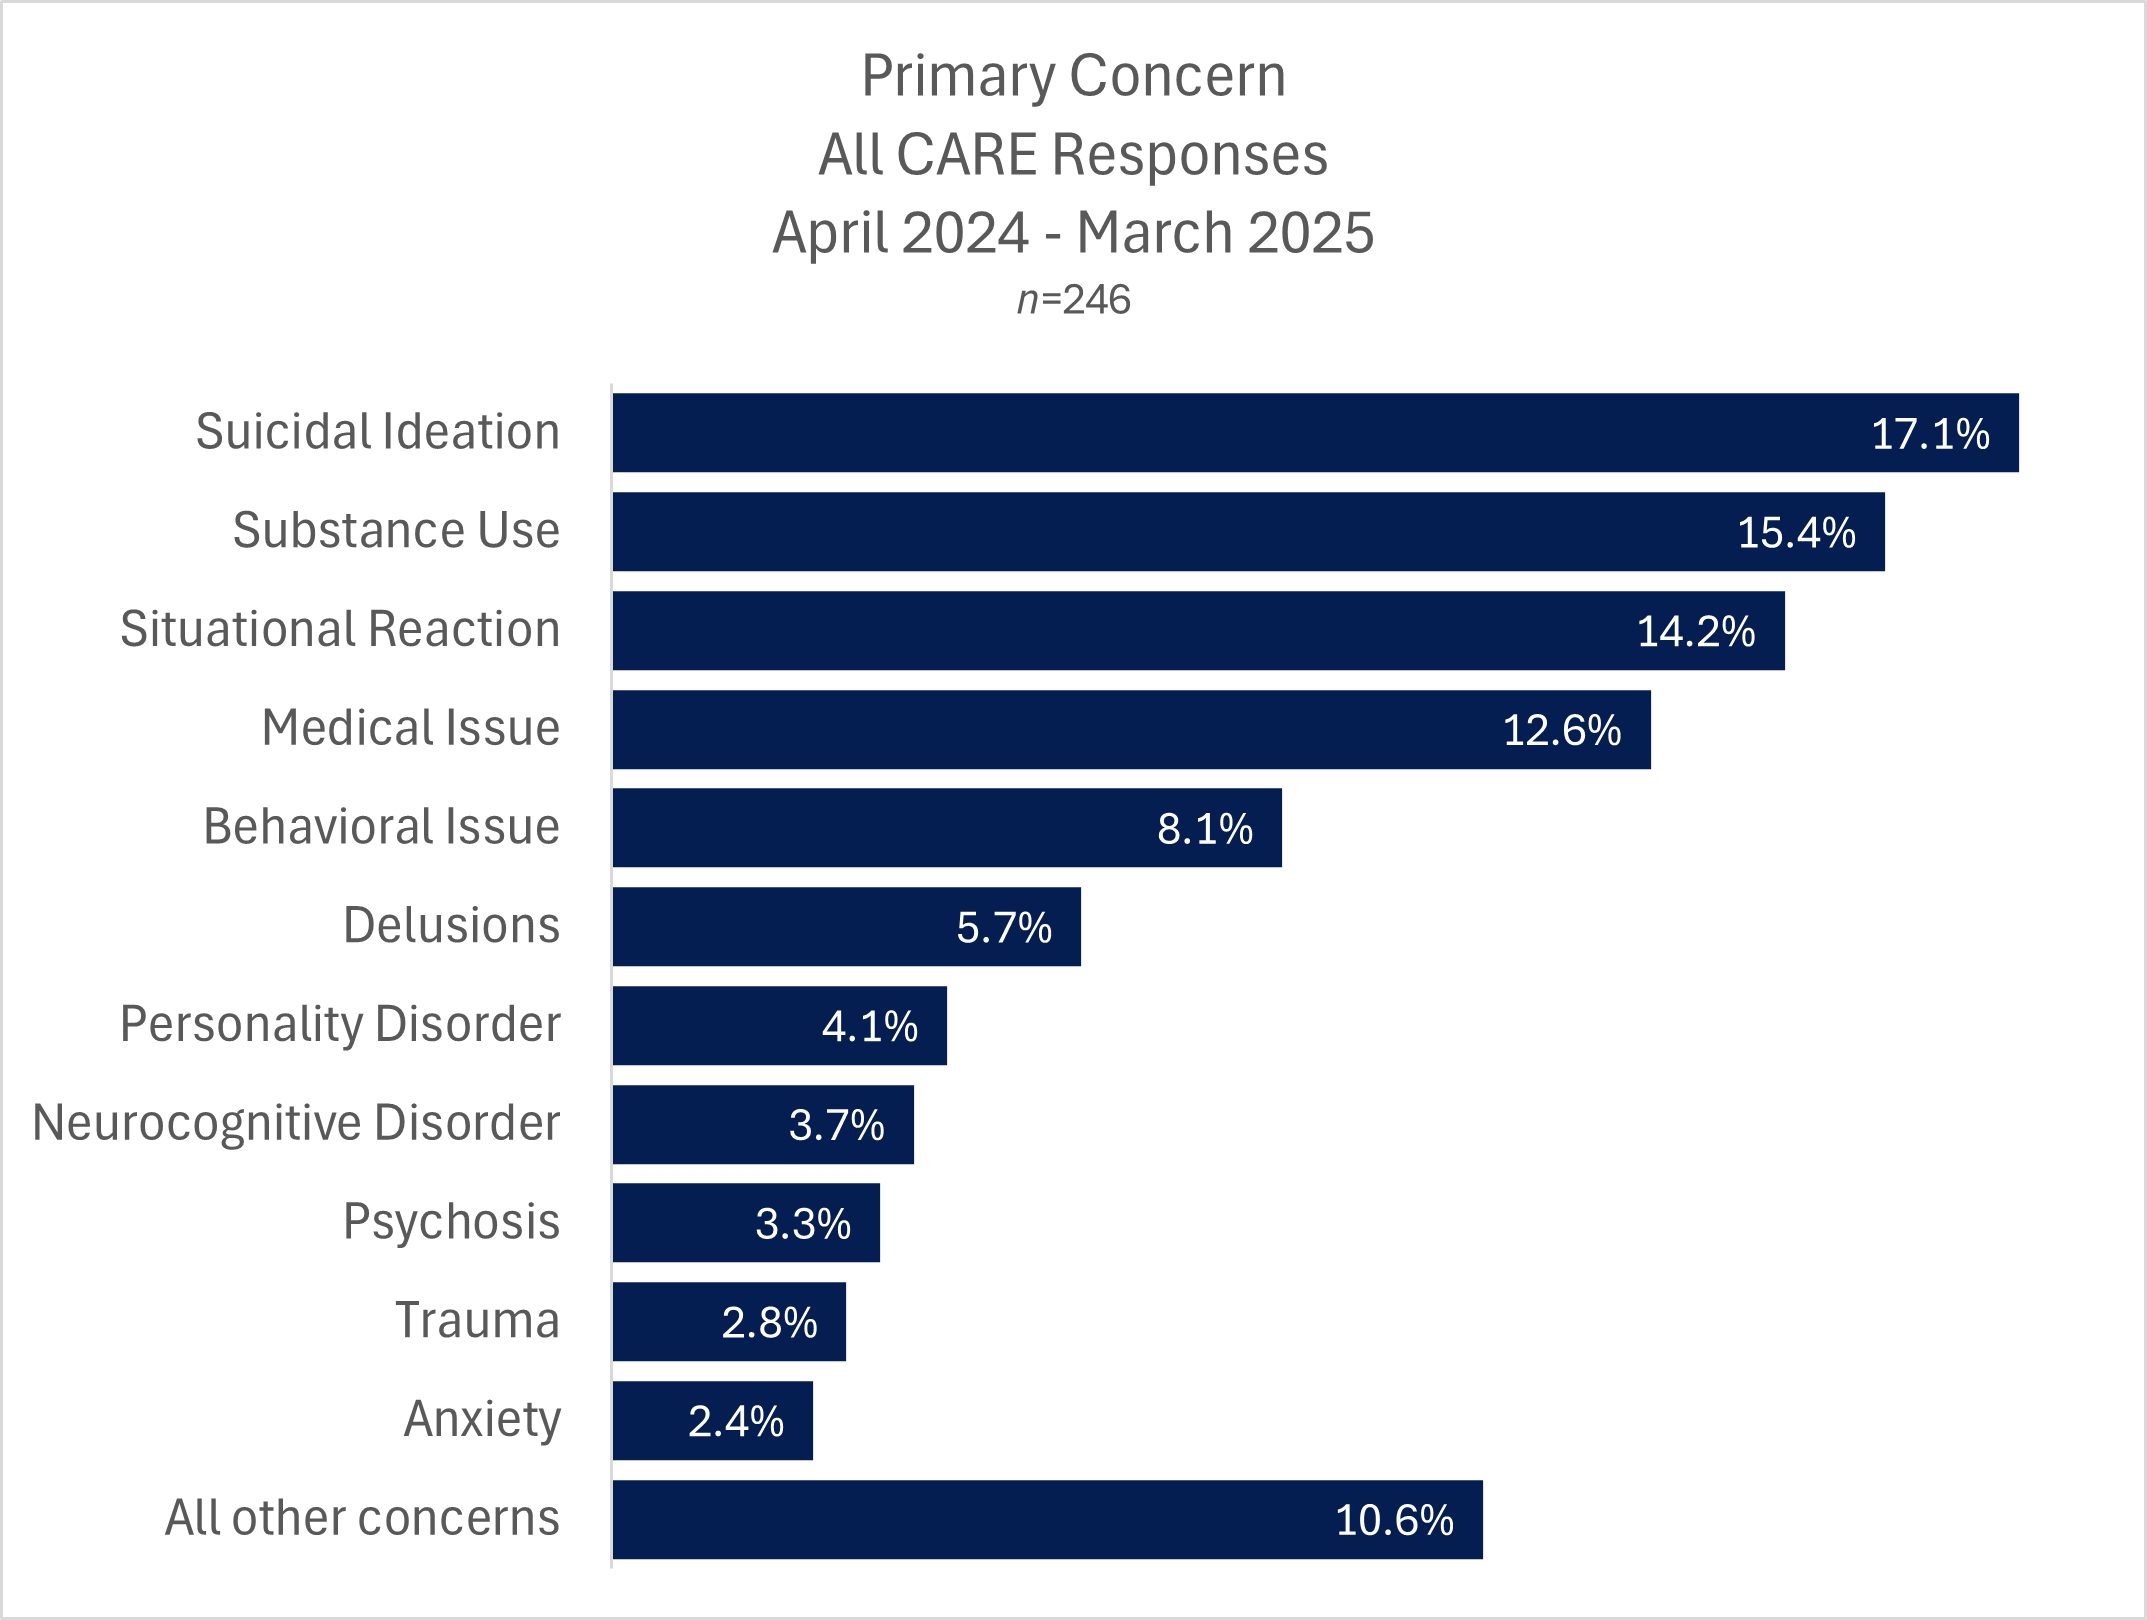
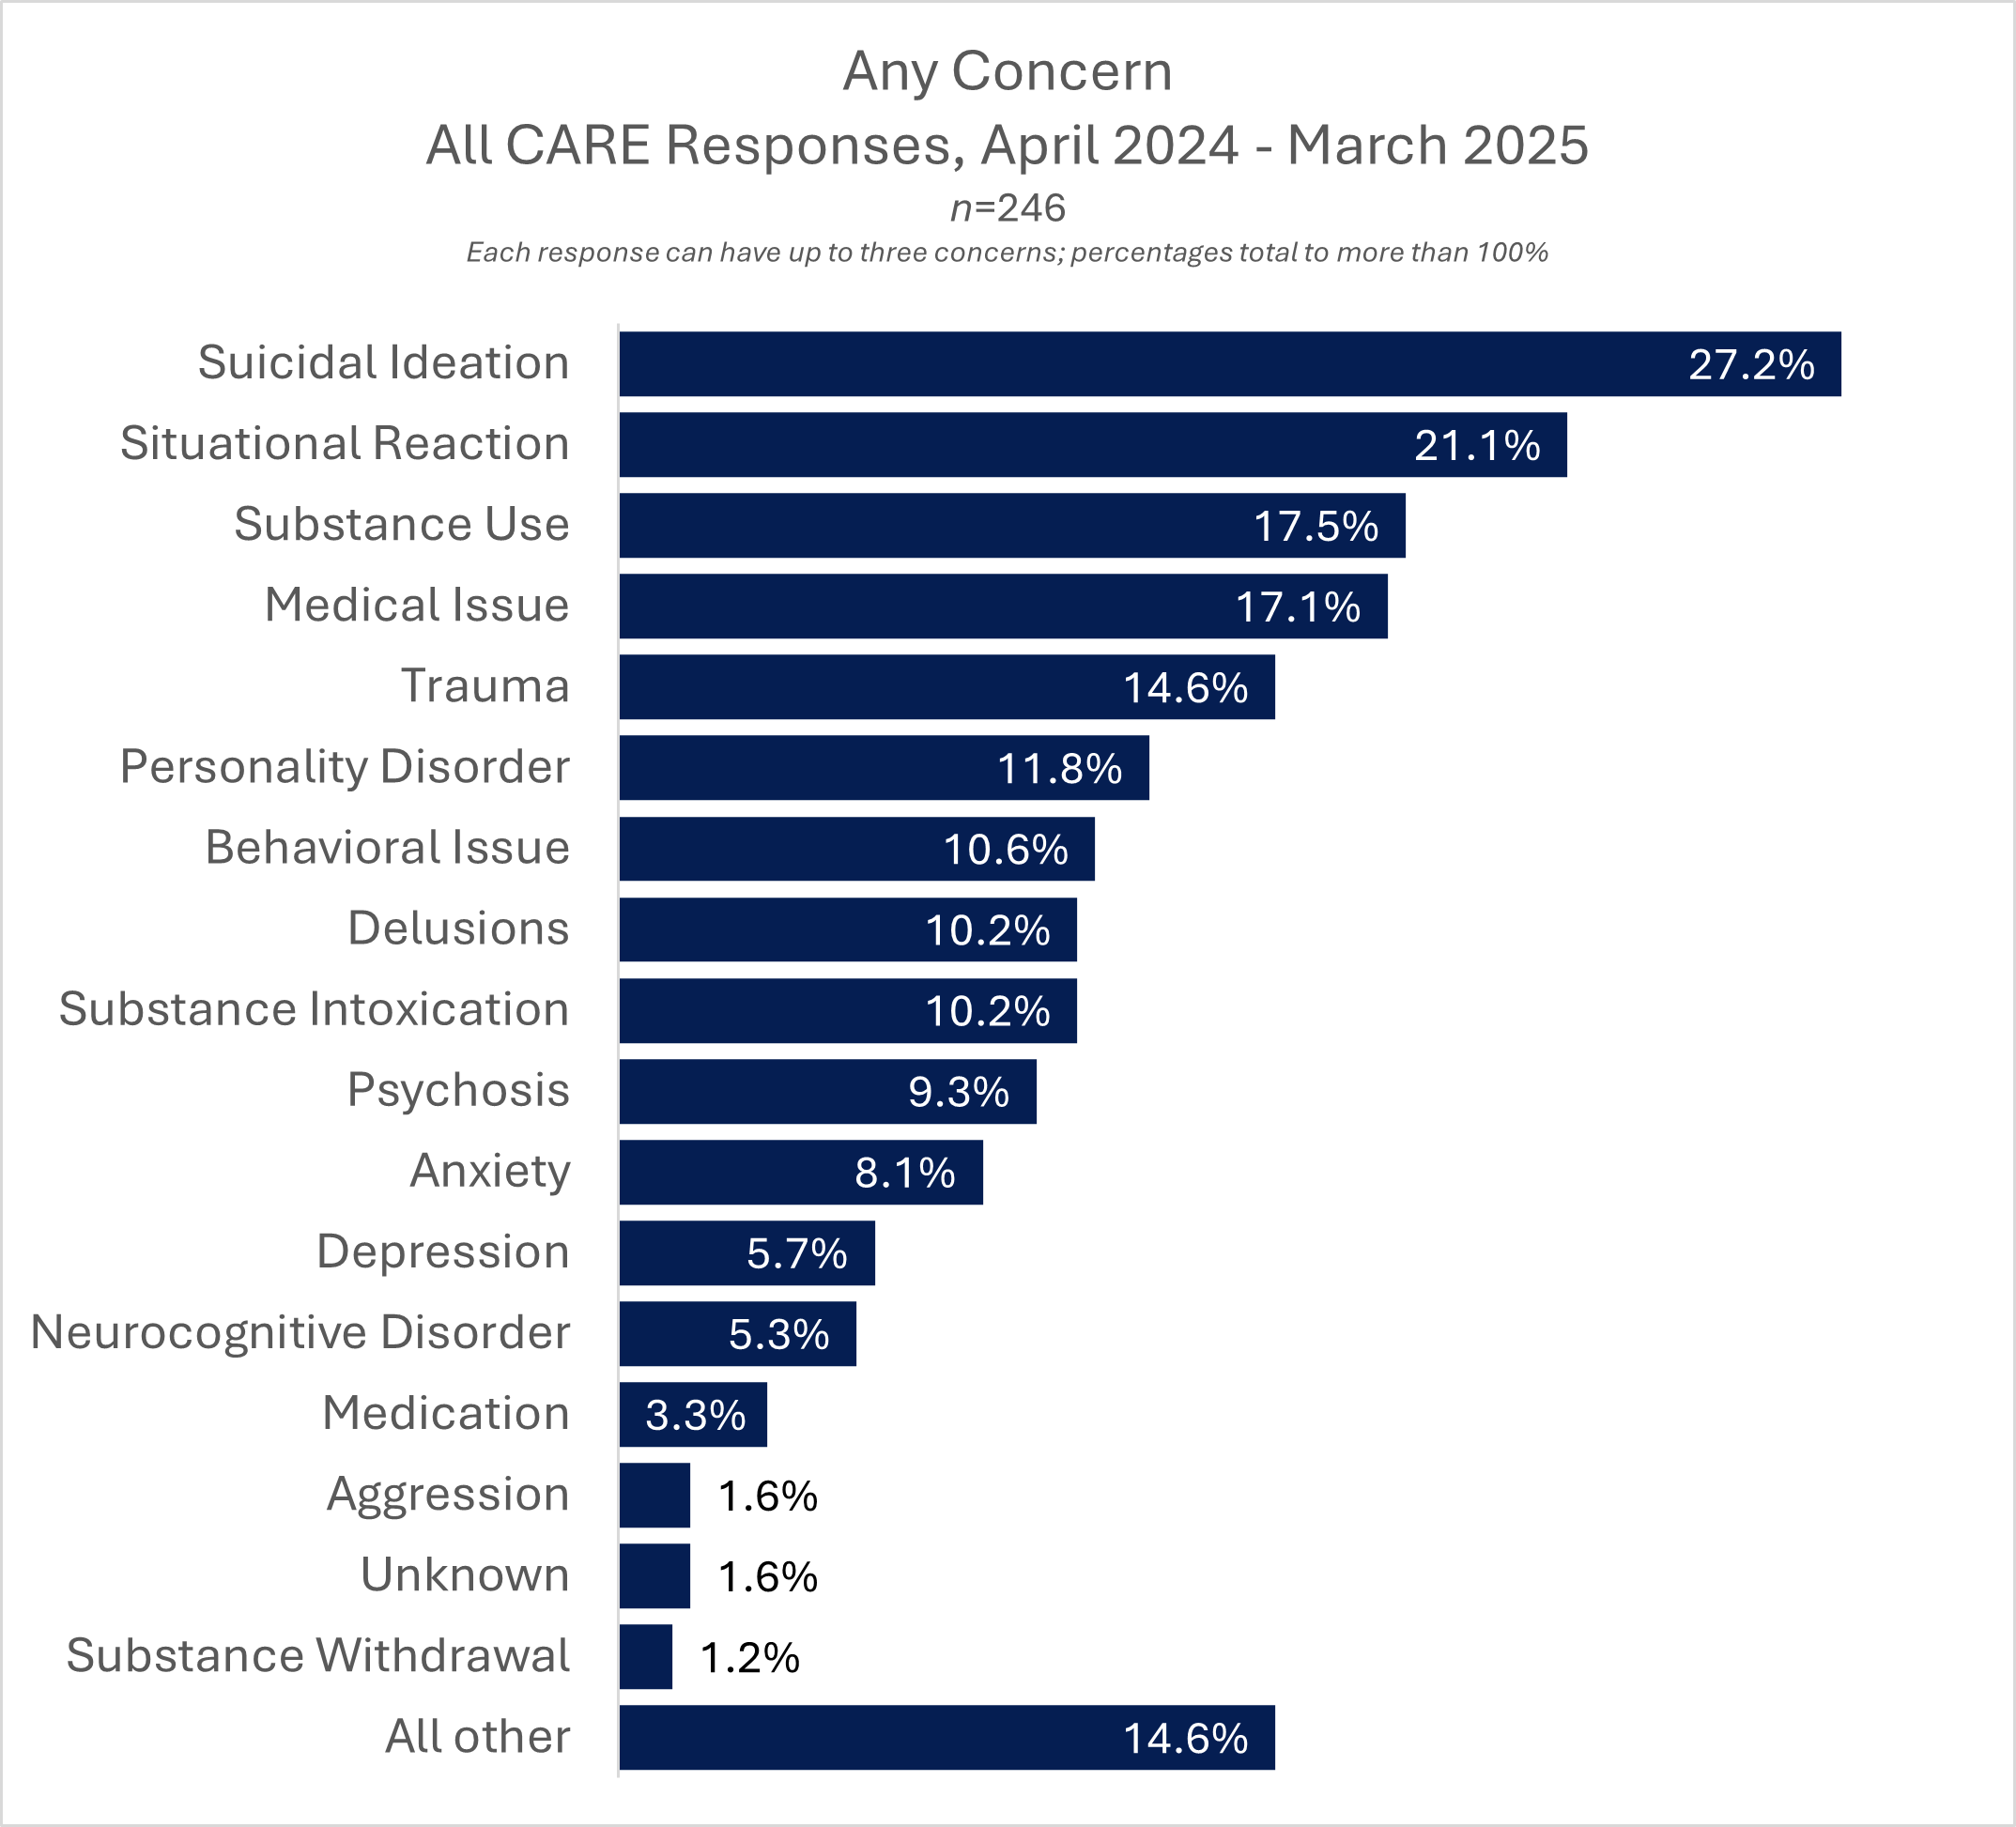
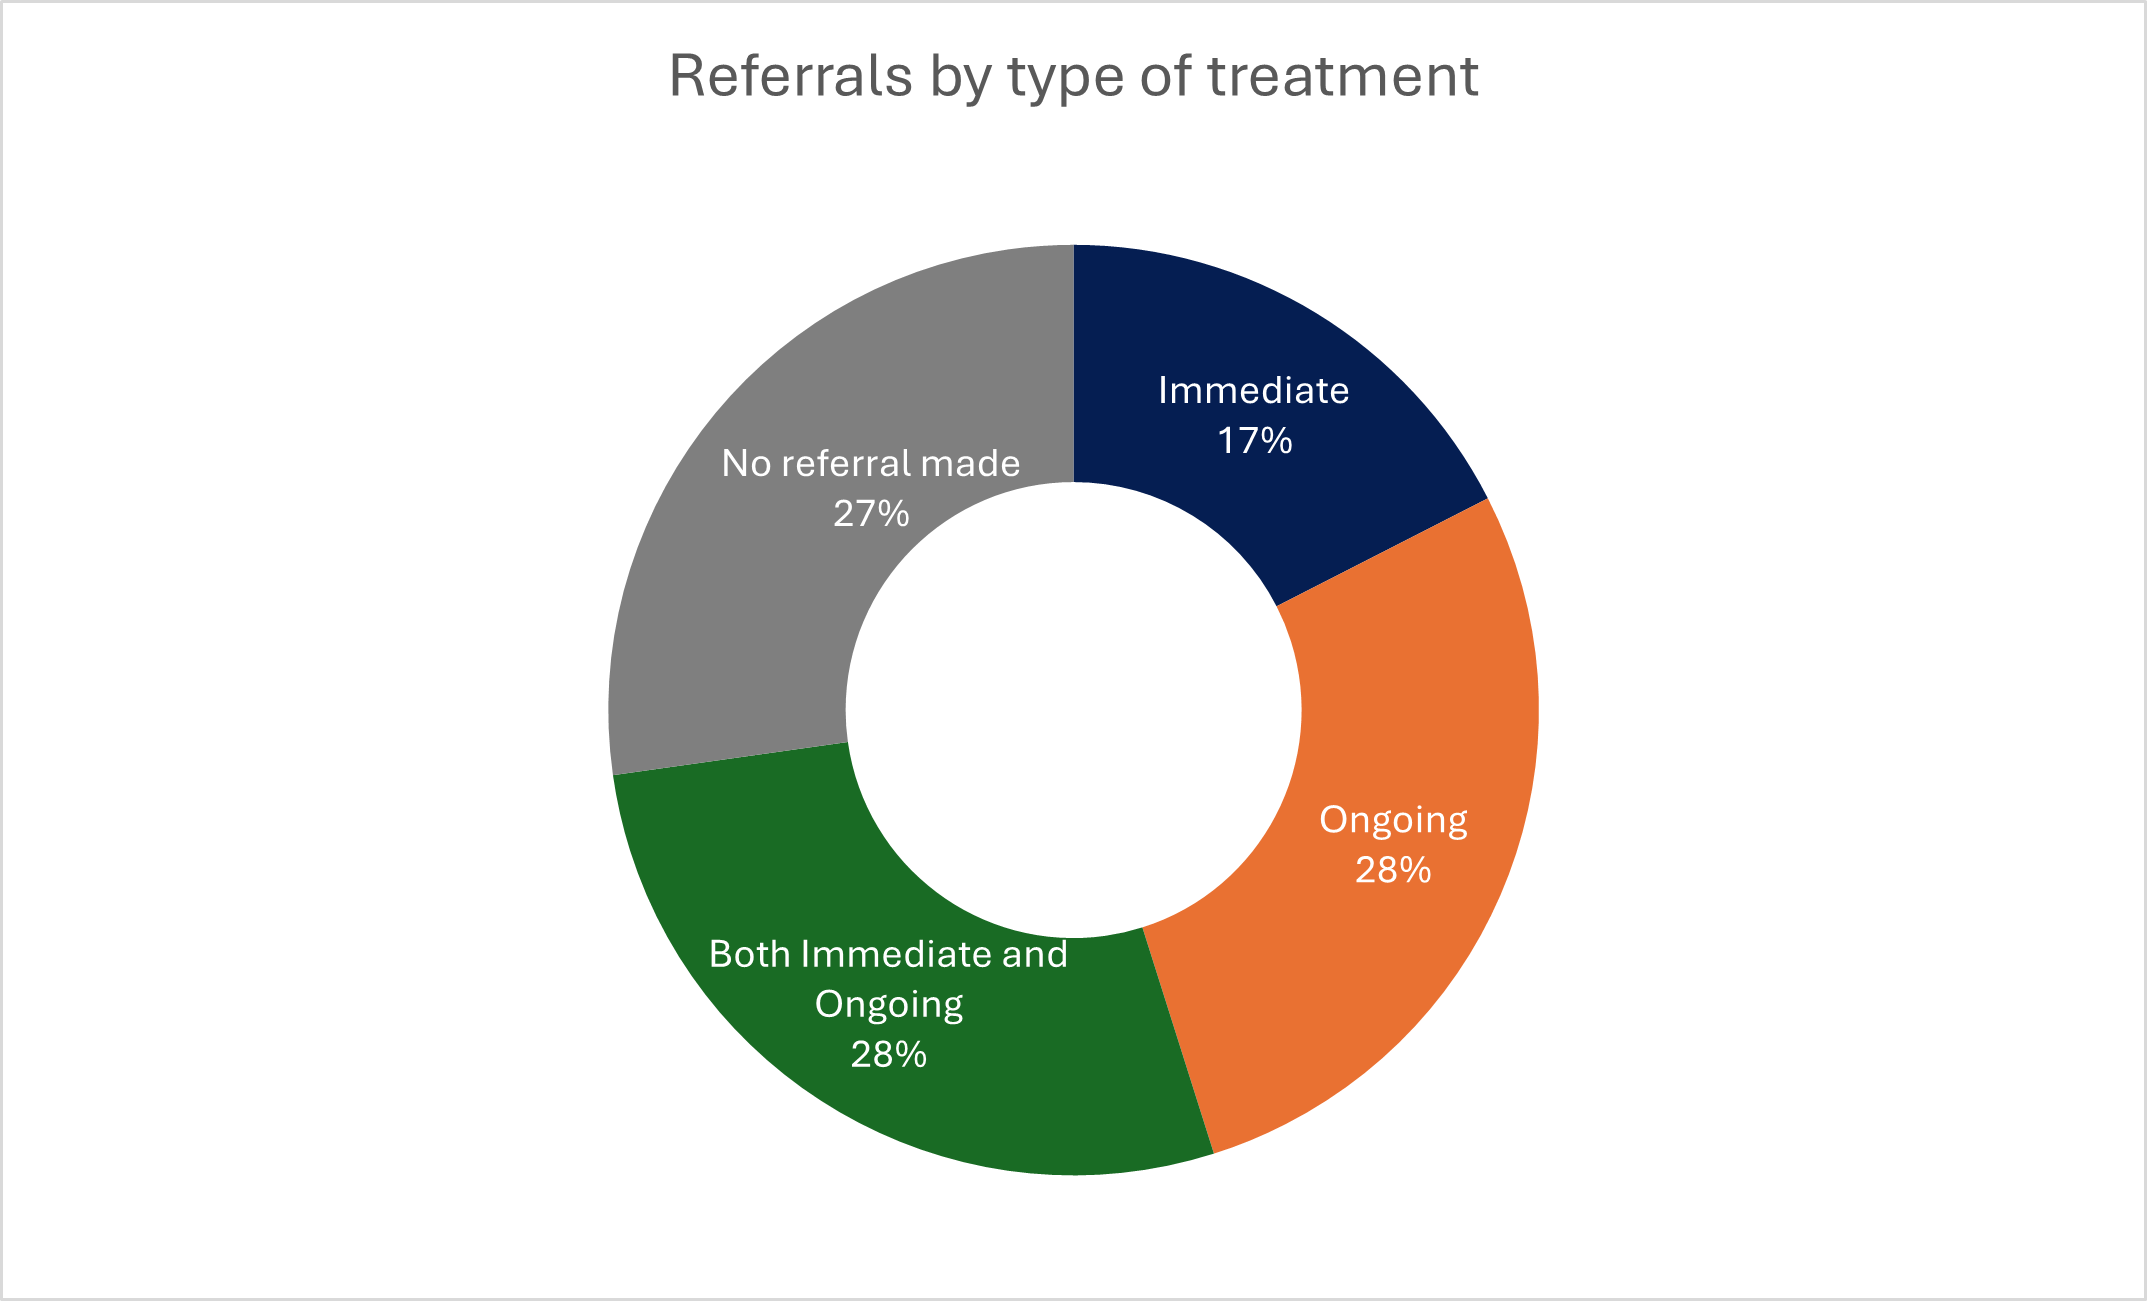
During its first full year of operation (April 2024 through March 2025), CARE completed 246 responses, serving at least 179 distinct individuals. Most people had only one contact with the team and the majority of incidents were resolved without the need for police or hospital transport. Over half of all CARE calls ended with the person remaining safely in the community, while nearly three-quarters of responses resulted in referrals to additional services such as case management, walk-in crisis care or medical treatment.

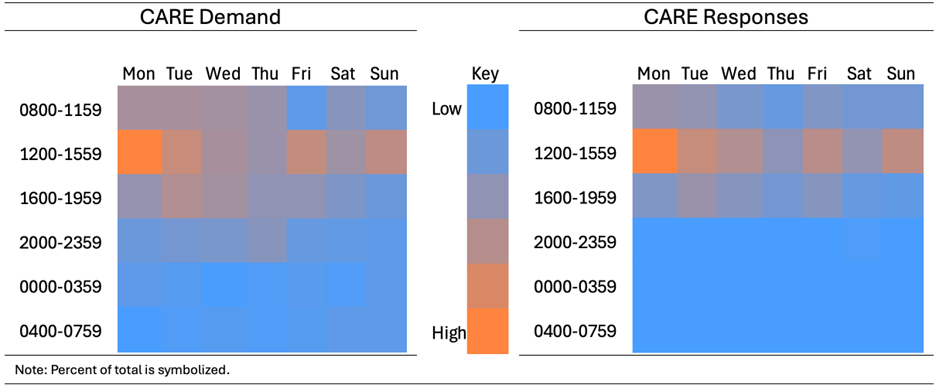
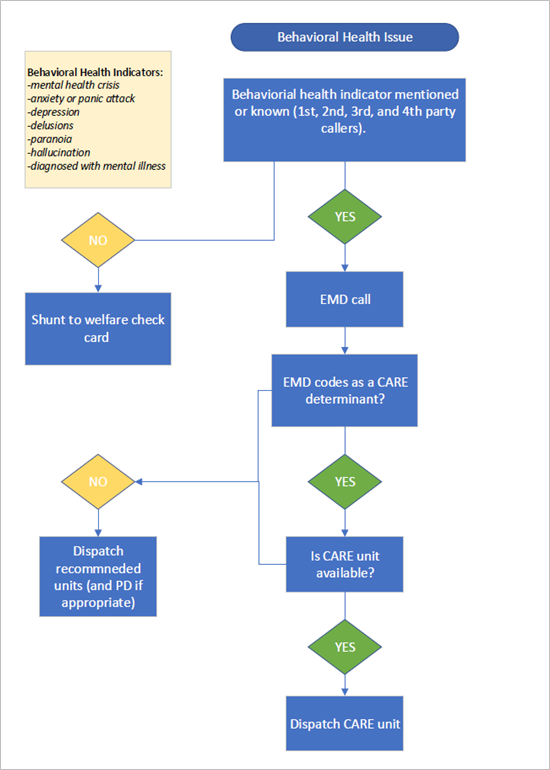
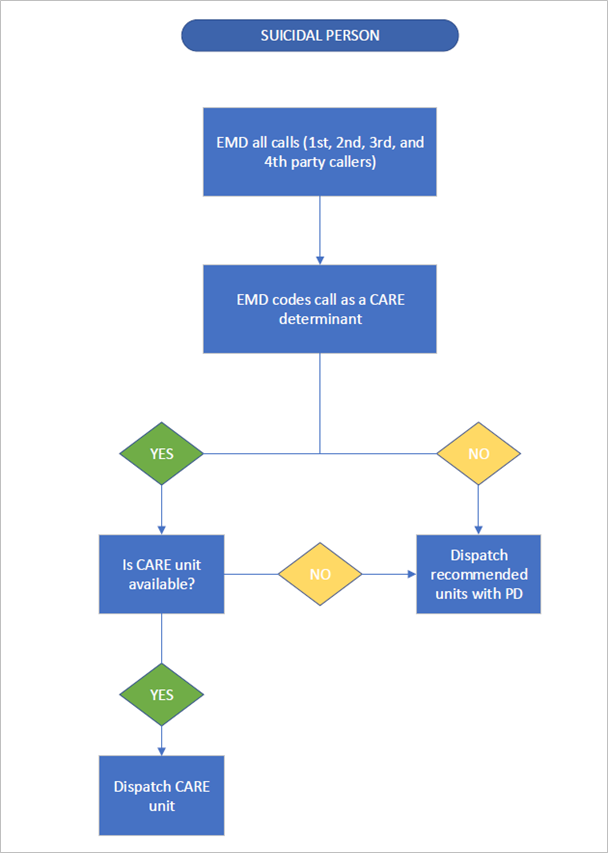
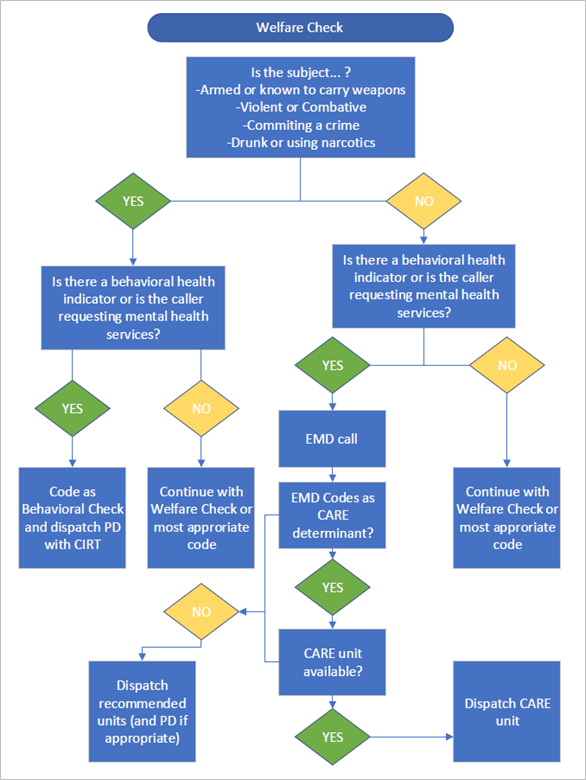
Strict dispatch protocols, designed to protect both responders and the public, limited the types of calls CARE could handle. This conservative approach led to low call volume and under-utilization of paramedics dedicated to the program. Staff interviews highlighted the value of CARE’s compassionate, health-focused approach—community members often engaged more readily with teams that did not include police—but also pointed to a need for more flexible dispatch criteria and better alignment across partner agencies.

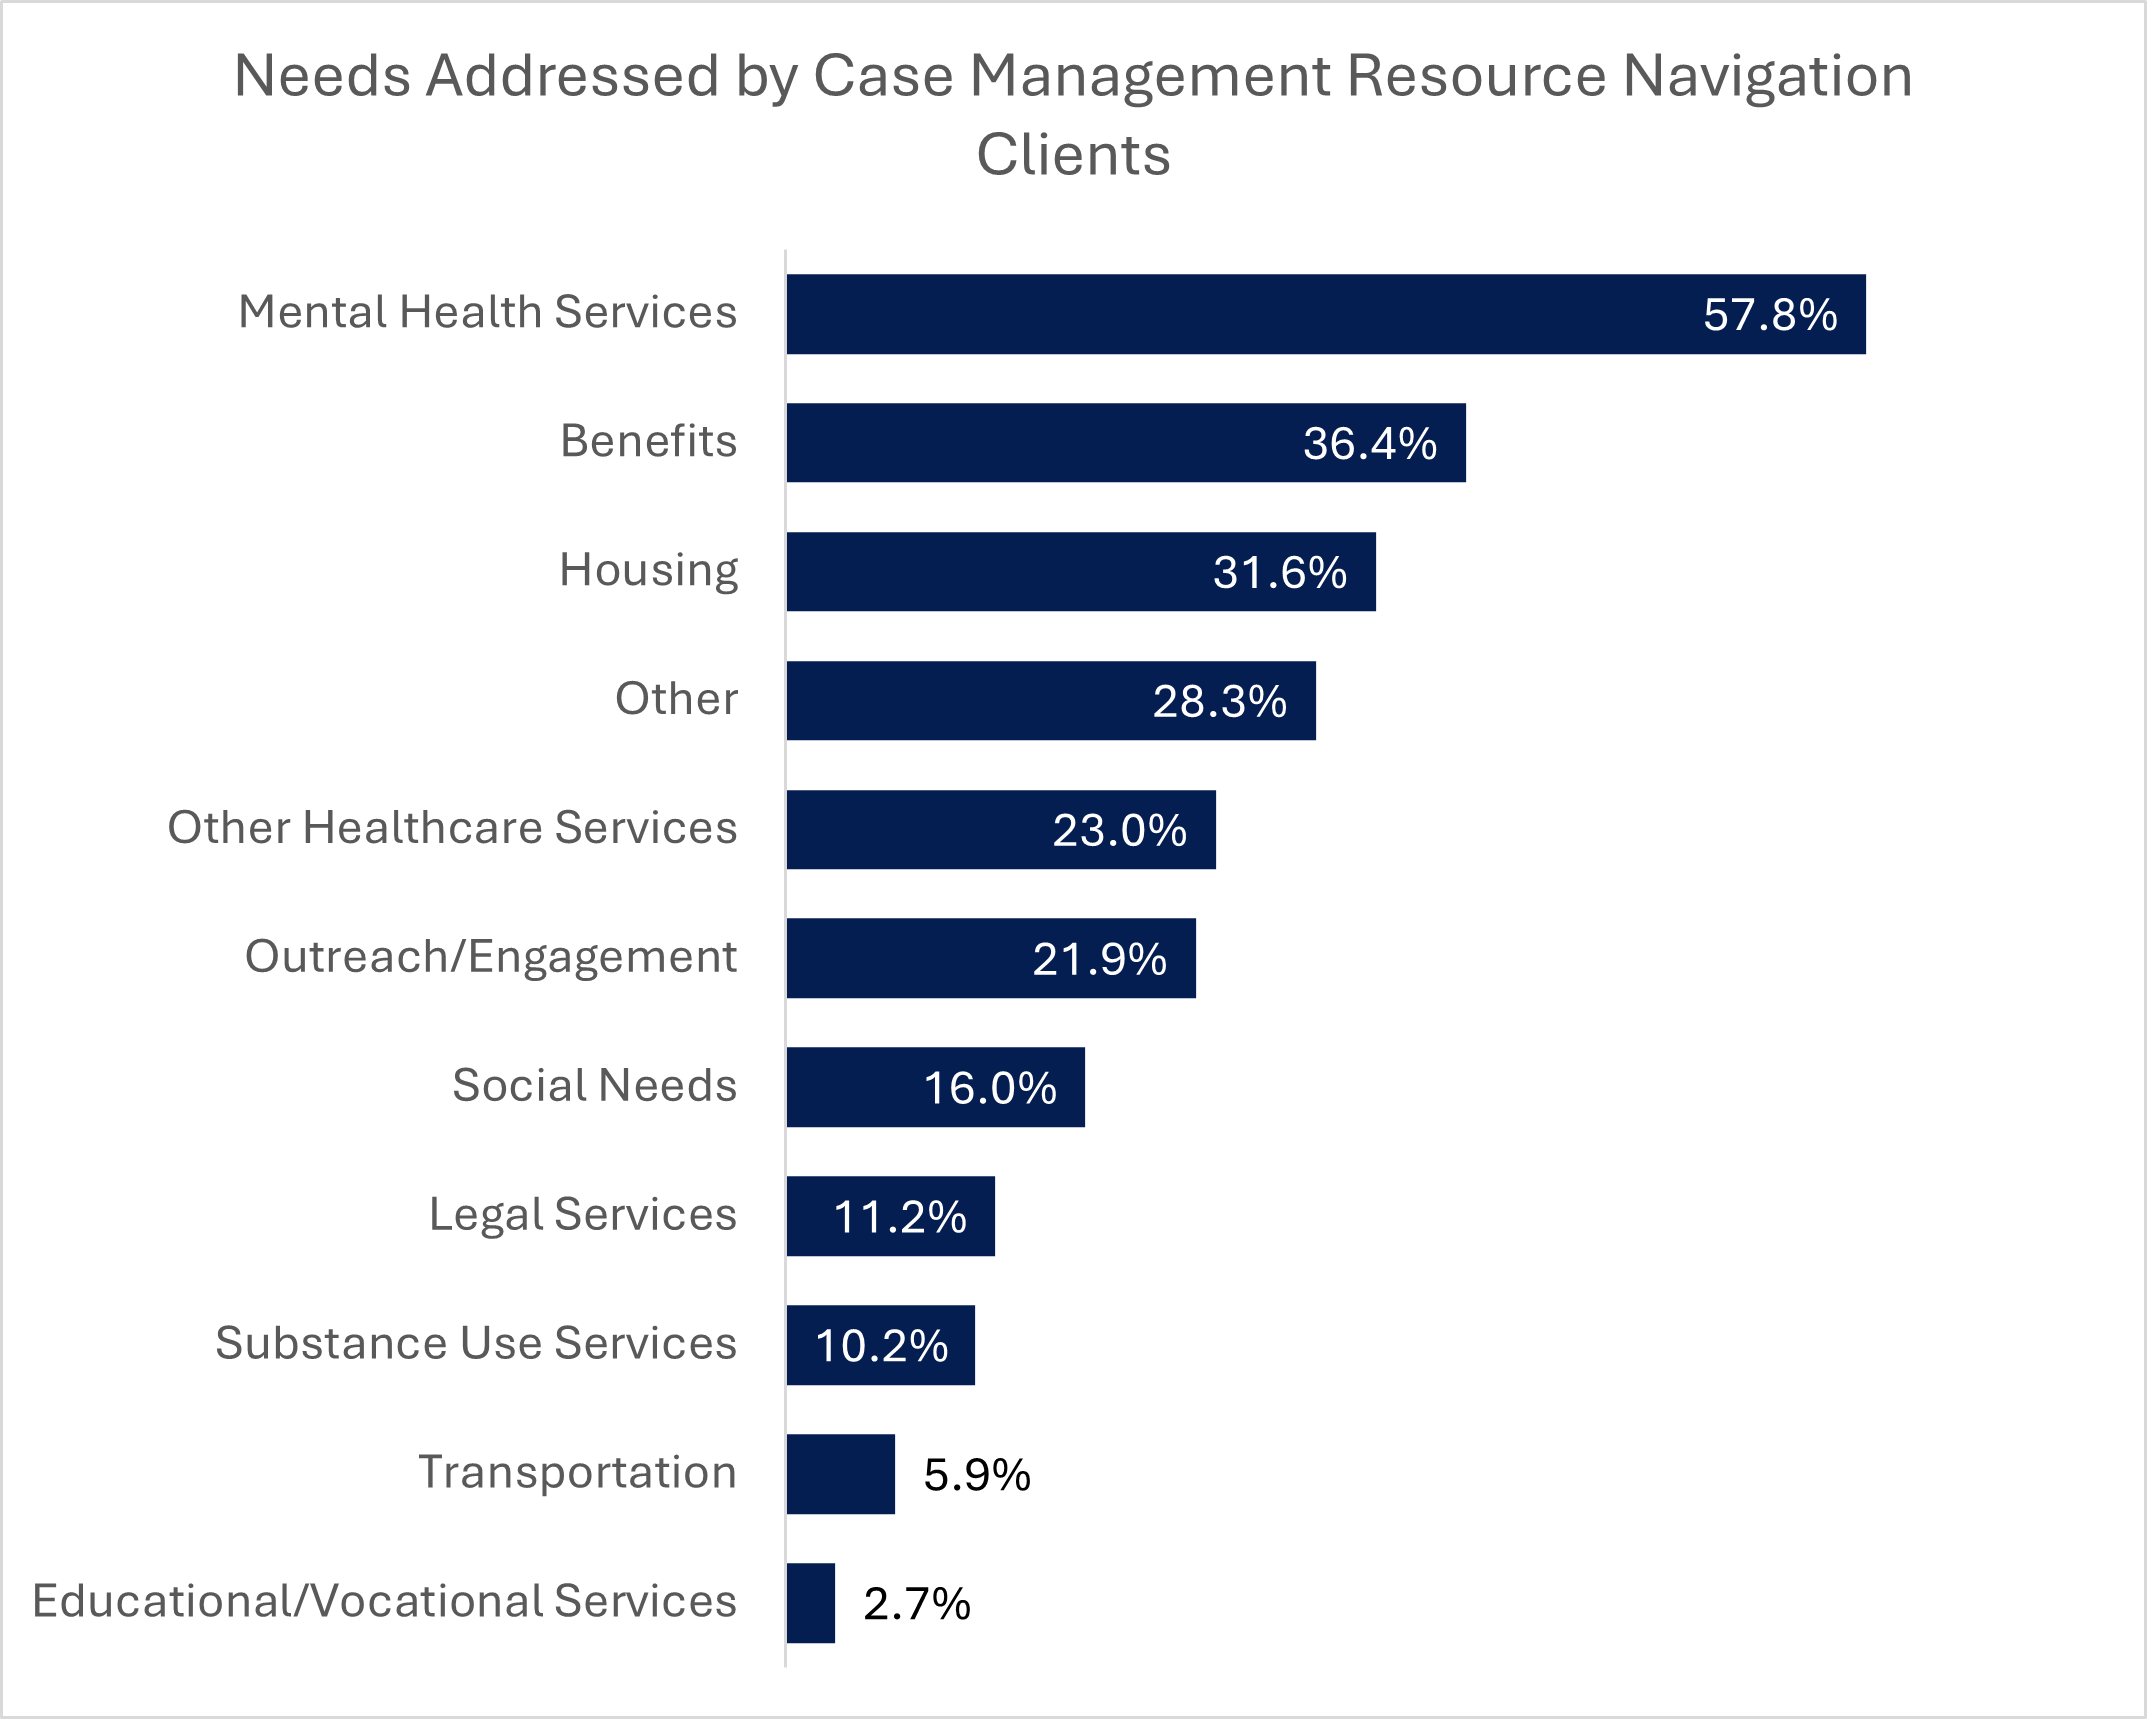
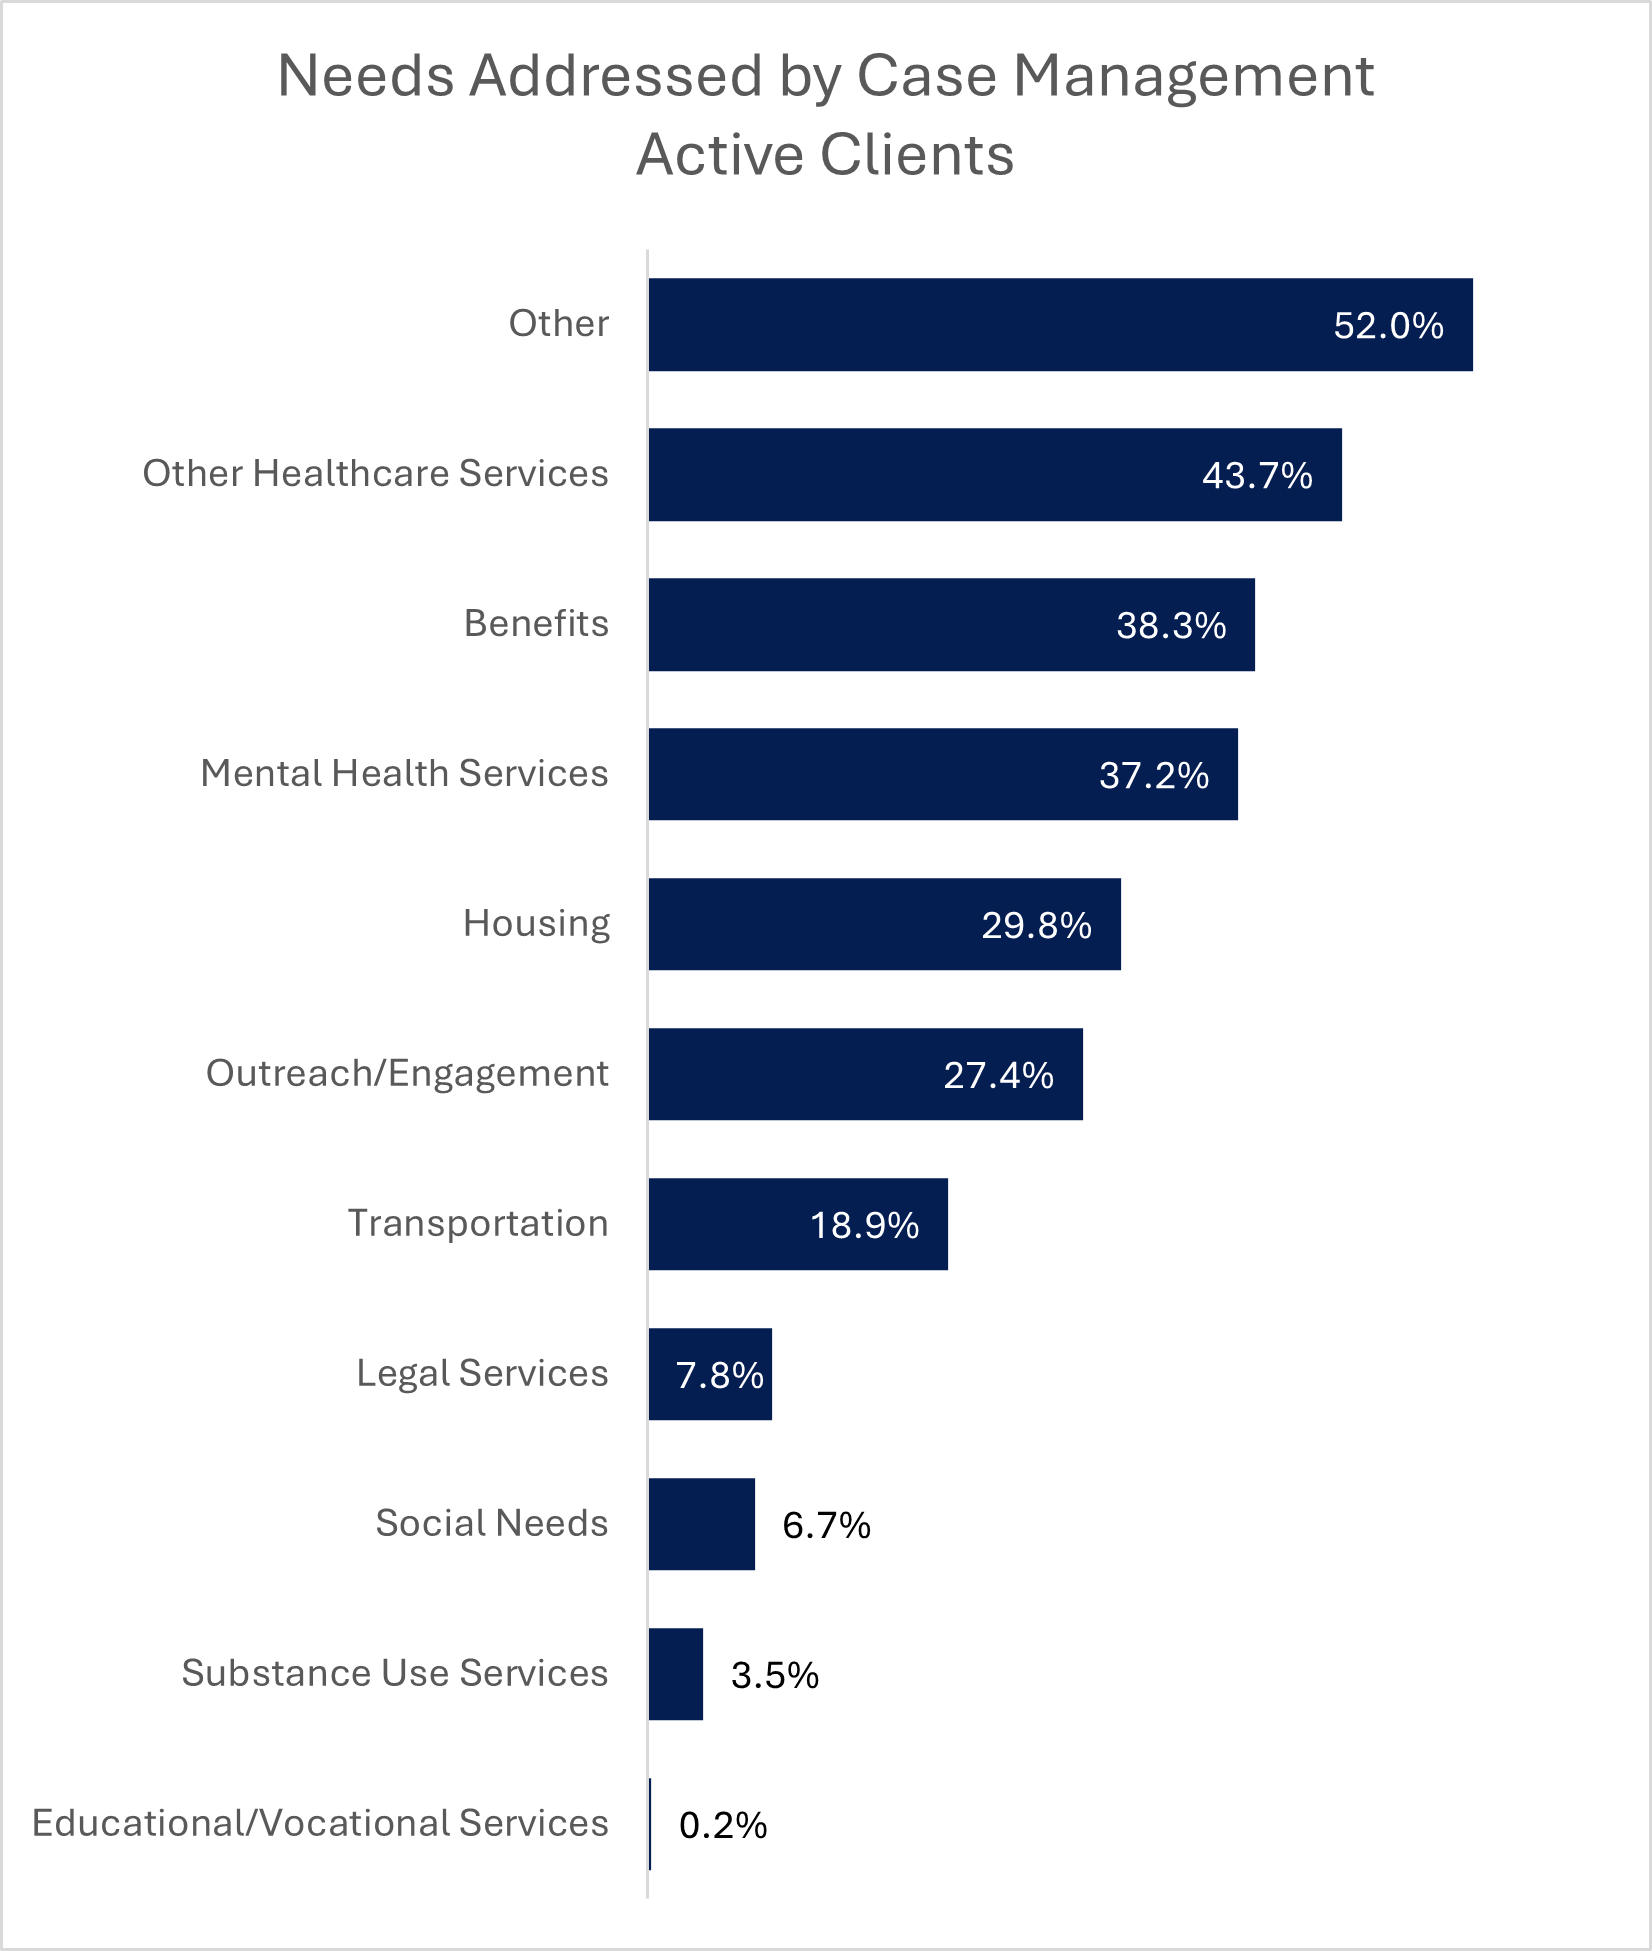
CARE’s clinical case management services emerged as a major strength. Case managers provided short-term, individualized support to help clients access benefits, treatment and housing. This ongoing engagement reduced the likelihood of repeated crises and strengthened collaboration among local service providers.

Overall, CARE proved that non-police crisis response can be safe, effective and well-received by the community. However, the number of calls appropriate for this model was relatively small. The findings suggest that Boulder should retain a non-police option as part of its broader behavioral health continuum, but dedicated paramedic staffing may not be the most efficient structure under current demand. Going forward, refining dispatch protocols, improving interagency coordination, exploring community paramedicine models with a broader scope of practice and expanding case management capacity will help Boulder build a more integrated and sustainable crisis response system.

Introduction

Communities across the United States are exploring alternatives to traditional law enforcement responses for individuals experiencing behavioral health crises. This report describes an effort by the City of Boulder to send a multidisciplinary team consisting of a behavioral health clinician and a paramedic in response to 911 and police non-emergency line calls for certain types of behavioral health crises. This effort was called CARE: Community Assistance Response and Engagement.

The City of Boulder has a long history of providing alternatives to police-only responses to behavioral health crises. The Crisis Intervention Response Team (CIRT) was launched in February 2021. CIRT is a co-response team of licensed behavioral health clinicians from the city’s Housing and Human Services Department (HHS) who respond with Boulder Police Department (BPD) officers. Both clinical experience of clinicians in the field and input from stakeholders suggested that some incidents likely did not require police involvement to resolve. Additionally, some persons in crisis do not respond well to the presence of a police officer, regardless of how well-intentioned and well-trained the officer may be.

Consistent with best practice in the field and peer programs in Eugene, Oregon and Denver, Colorado, the city wanted pairs of professionals to respond to these calls. There was also anecdotal evidence that some behavioral health crises involved a medical component or that medical problems were co-occurring with behavioral health crises. Boulder Fire-Rescue (BFR) was well-positioned to hire and supervise paramedics who could fill this role and hoped that having dedicated paramedics for health crises could divert lower-acuity calls from the 911 system.

Discussion of these issues between the Boulder City Council, HHS, BFR, BPD, and Boulder Police and Fire Communications (BPFC, Boulder’s 911 call center) started in mid-2022, about a year after CIRT launched, and the CARE pilot program began in December 2023. There was initially one CARE unit consisting of a dedicated paramedic and behavioral health clinicians shared with CIRT. In March of 2024, a second CARE unit was introduced to enhance capability.

This report was prepared by Bauman Consulting Group under contract with the City of Boulder to provide analysis and evaluation services. This report follows a prior report on CIRT’s crisis intervention responses during 2022 and 2023 and focuses on the CARE program. Additional analyses of work done by the team’s clinical case managers, who serve community members referred by CIRT or CARE, are also included in this report.

Dispatch Protocol

The initial indicators used by 911 dispatchers for a CARE call included mental health crises, anxiety, panic attacks, depression, delusions, paranoia, hallucinations and suicidal ideation. CARE could be dispatched to these incidents when there was no criminal activity, no threat of violence, and no weapons involved.

The call-taking process initially lacked a structured questioning framework, relying on the call taker’s discretion and a process map adapted from Denver’s STAR program. This process resulted in some dispatcher uncertainty over what types of calls were appropriate for CARE. This uncertainty tended to result in under-utilization of CARE out of an abundance of caution and a tendency to default to more established response structures.

In late March of 2024, BPFC began using structured questioning protocols from the International Academies of Emergency Dispatch (IAED). These protocols are a systematic, guided triage process for emergency medical dispatch based on caller-provided information. The goal was to accurately determine the event type, resources required and response mode. These protocols had previously been in use by BPFC for medical calls and were applied to calls involving behavioral health as well. The protocol was revised again in May 2024, expanding the scope of work for CARE to allow for slightly more uncertainty regarding the breathing status of the person and unknown problems. The final dispatch process map, using IAED protocols, is attached as Appendix II.

Throughout the duration of the CARE pilot program, all departments involved — BPFC, HHS, BFR, and BPD — worked collaboratively to produce a non-police response to crisis calls that met community need without compromising safety. Interviews with staff suggested that this was largely successful, with few situations escalating beyond the training and capacity of CARE teams. As described in more detail below, however, this conservative approach ultimately resulted in low utilization of the CARE team. While not zero, the number of calls for which CARE was appropriate was low.

To ensure that changes in dispatch protocols do not impact this report’s findings, much of the remainder of this report focuses on the one-year period from April 1, 2024, through March 31, 2025, which also aligns with the time period when the CARE team was fully staffed and generally available from 9:00 am to 7:00pm, seven days a week.

Administration and Culture

CARE was a collaboration between HHS, BPFC, BFR and BPD. At the level of field staff, two paramedics were dedicated solely to CARE and behavioral health clinicians were shared with CIRT. CIRT was an already well-established program with strong ties to BPD both at the administrative level and among field staff.

We conducted interviews with behavioral health clinicians and line-level supervisors, along with management and executive staff at HHS. We also interviewed BPFC and BFR executive staff. Different program visions emerged from these interviews, with HHS staff having envisioned a flexible, non-police response that could maximize engagement and follow-up, while BFR’s approach emphasized rapid response and intervention through protocol-driven deployments. The result was inconsistent expectations around roles, goals and success metrics which is natural when bringing departments with different cultures together as CARE attempted to do.

Clinicians expressed frustration with the strict dispatch protocols. CIRT clinicians are able to assign themselves to incidents where police have been dispatched. CARE, on the other hand, was limited to only those incidents where BPFC’s protocols determined that CARE was the appropriate resource. This was true even when there were incidents involving persons or places to which CARE had previously responded. Clinicians understood that the protocols were in place to ensure the safety of both CARE team members and the community. The clinicians agreed with the dispatch protocols in principle, but in practice, clinicians felt the protocols were overly rigid.

Another issue that caused frustration was that some calls that appeared appropriate for CARE at the dispatch level ended up needing police involvement. This could occur in situations where a third party was reporting that someone was in mental health crisis, but they didn’t know their location. CARE staff did not have access to law enforcement tools such as databases to find someone’s current address, or the ability to ping someone’s phone. BPD also got involved in situations where the subject of the call was intoxicated and needed transport to detox, or when someone involved in the call requested a police report. These situations highlighted challenges with determining the right response during the initial call to dispatch.

CARE paramedics were assigned exclusively to the CARE program. Due to limited call volume, dispatch protocols and a narrowly defined scope of the program, they were not consistently utilized to the full extent of their training — particularly compared to what is possible in a broader community-paramedic model. Dispatch protocols also required that a paramedic perform an assessment to determine whether an individual met defined patient-criteria.

While behavioral health clinicians could flex between CARE and CIRT, paramedics did not have the same cross-assignment options, resulting in periods within their 10-hour shifts without active calls. However, paramedics contributed through follow-ups and supportive outreach when not on CARE calls which is closer alignment to a community-paramedic model. The observed under-utilization reflects the design and scope of the CARE program rather than any limitation of the paramedic role.

Despite these operational and administrative challenges, the staff that were interviewed for this report found value in non-police responses to health crises. Clients would sometimes engage more willingly with teams that did not include law enforcement, and staff reported positive outcomes from case management as well. While some clinicians had safety concerns before the program began, all clinicians we interviewed reported that there were few safety concerns in the field and attributed this to the careful dispatch protocols.

Services Provided by CARE

Crisis Intervention and Response

The CARE team consisted of licensed behavioral health clinicians, case-managers and two paramedics. The CARE program shared behavioral health clinicians and case management staff with CIRT; the paramedics were dedicated CARE resources. Responses were requested by the City of Boulder’s Police and Fire Communications Center (BPFC, 911 dispatch) after a community member called 911 or the police department non-emergency line to report a concern. Unlike CIRT, CARE could not assign itself to incidents in the computer-aided dispatch system — responses were dispatched through the 911 call center.

Clinical Case Management

Clinical case managers worked alongside behavioral health clinicians to support individuals following a crisis, addressing the underlying service gaps that often contribute to repeated emergencies. During the CARE analysis period, three clinical case managers provided short-term, intensive assistance to connect people with benefits, treatment, and community resources. Many clients struggled with barriers such as insurance issues, long waitlists, or difficulties accessing medications. Because these needs often couldn’t be resolved during an acute crisis, the addition of clinical case management gave the team a way to sustain engagement and reduce the likelihood of future crises. The model was intentionally low-barrier and person-centered, emphasizing trust and individualized support.

Each case manager typically carried a caseload of 10–15 people at a time, allowing for consistent contact and relationship-building. They coordinated closely with treatment providers, helping align fragmented services and ensure clients received cohesive care. This collaboration extended to community outreach, with case managers strengthening relationships among local providers and advocating for clients who might otherwise be turned away. Clinicians report that case management improved both client outcomes and their own sense of effectiveness, giving them confidence that care could extend beyond the moment of crisis.

CARE Responses April 1, 2024 – March 31, 2025

There were 246 documented CARE responses from April 1, 2024, through March 31, 2025. The number of responses per day ranged from zero to three, with an average of 0.67 responses per day. More than half (52.3%) of calendar days from April 1, 2024 to March 31, 2025 had zero CARE responses. When there were any CARE responses, the most common number of calls per day was one (32.3% of calendar days), with some days having two responses (11.0% of days) or three responses (4.4% of days).

The average number of responses varied by day of week, with the highest average on Monday (0.96) and the lowest on Saturday (0.48). Table 1 shows the average number of CARE responses for each day of the week.

Table 1: Average count of CARE responses by day of week, April 1, 2024 - March 31, 2025

Day of weekAverage number of CARE responses
Mon

0.96

Tue

0.87

Wed

0.67

Thu

0.44

Fri

0.71

Sat

0.48

Sun

0.58

Overall average

0.67

Since CARE had its own unique call type set up in the dispatch system, demand was measured by the number of CARE calls generated throughout the day, whether the team was in service or not. The left pane of Figure 1 shows a time of day and day of week heat map for this proxy measure of demand. Percentage of the total number of calls is symbolized, with periods of higher demand shown in orange and periods of lower demand shown in blue. More than two-thirds (68.1%) of demand occurred between 9:00 a.m. and 7:00 p.m. Demand was higher earlier in the week, particularly on Mondays, Demand was low between midnight and 7:00 a.m., with only 11.9% of demand during those hours.

The right pane of Figure 1 shows a heat map of CARE responses. CARE responses generally follow the staffing pattern for CARE, with 99.2% of responses beginning during the hours of 9:00 a.m. to 7:00 p.m. Like demand, responses occurred more frequently earlier in the week, particularly on Mondays.

Figure 1: Demand and CARE Responses time of day and day of week heat maps

Two-panel heat map comparing CARE demand and CARE responses by time of day and day of week.

Image long description: Two-panel heat map comparing CARE demand and CARE responses by time of day and day of week. Both panels use color to represent relative volume, with higher values in warmer tones and lower values in cooler tones. CARE demand is highest between 12:00 and 3:59 p.m., especially on Mondays, with moderate demand on other weekday afternoons and lower demand in evenings and overnight hours. CARE responses follow a similar pattern, with the highest response volume between 12:00 and 3:59 p.m. on weekdays and consistently low response volume during evening, overnight, and early morning hours. A key indicates relative levels from low to high, and a note states that values are shown as a percent of the total.

The average number of hours spent on calls for service per week was 4.9, with an overall monthly average of 21.2 hours. There was no clear seasonal pattern to utilization, as shown in Figure 2.

Figure 2: Total monthly hours on calls for service, CARE

Total monthly hours on calls for service, CARE

Image long description: Bar chart titled “Total monthly hours on calls for service, CARE” showing monthly CARE call hours from April 2024 through March 2025. Hours range from a low of 9.0 in April 2024 to a peak of 30.3 in September 2024. Higher activity occurs in late summer and early fall, with 29.7 hours in August and 26.5 hours in October. Hours decline in December to 15.0, increase again in January 2025 to 25.3, and then decrease to 19.0 in February and 18.5 in March.

In interviews, multiple CARE staff discussed how some of the low utilization may have been due to lack of availability of a CARE team on some days. Availability was impacted due to illness, vacation or training, which, given the low staffing of the CARE team, could take the team offline for an entire day. Anecdotally, this may explain some of the zero-response days — however it is unlikely to explain the low utilization on days when the team responded to at least one call. On days with at least one response in the community, the average time in the field responding to calls was 1.5 hours, with 40% of days with at least one call having an hour or less spent on responding to requests for assistance. Time in the field is not the entirety of work conducted by CARE staff; both clinicians and paramedics have substantial reporting requirements on top of time spent in the field with community members. Even so, an average of 1.5 hours in the field suggests the team was underutilized.

Number of Persons and Demographics

CARE teams interacted with more than 179 distinct individuals in the 246 responses to requests for service. The exact number of distinct individuals[1] is not known because 34 individuals were anonymous, with no identifying information recorded. Of the 179 individuals that CARE was able to identify, most (87.7%) had one contact with CARE.Thirteen individuals (7.3%) had two contacts, and eight persons (4.5%) had three or more contacts. The maximum number of contacts for any individual was six.

All demographic categories have a relatively large number of people with unknown characteristics. This is largely due to the difficulty of asking for demographic information from people who are experiencing a behavioral health crisis. CARE staff ask community members for identifying information primarily to enable continuity of the person’s care. CARE does not, however, require positive identification when responding to a call for assistance from a community member. The result is often better care for the person experiencing a crisis, but this comes at the expense of data that is less than complete.

As shown in Figure 3, the gender of persons the CARE team responded to was split equally between female (40.2%) and male (39.0%), with 17.1% of unknown or unreported gender. The remaining percentage (3.7%) were transgender.

[1] CARE uses a combination of name and date of birth to avoid creating duplicate records of clients. When duplicate records are found, they are consolidated into a single record for the person.

Figure 3: Gender

Donut chart titled “Gender” showing the distribution of gender categories.

Image long description: Donut chart titled “Gender” showing the distribution of gender categories. Female represents 40.2 percent, Male represents 39.0 percent, Unknown represents 17.1 percent, and Transgender represents 3.7 percent.

Age was not known (or was not recorded) in one out of five contacts (22.0%). Small percentages of people were under the age of 18 (3.7%) or 89 years old or older (1.2%). Young adults aged 18-24 (8.5%) were slightly less common than people aged 25-64. The most common age category among people whose age was known was 55-64, at 14.2% of people.

Figure 4: Age

A horizontal bar chart titled “Age.”

Image long description: A horizontal bar chart titled “Age.” Largest group unknown 22%, followed by 55–64 at 14.2% and 35–44 at 12.6%. Smallest is 89+ at 1.2%.

The majority of CARE contacts were White (58.5%). There were some contacts with Black or African American community members (3.7%), and a small number of contacts with persons of other races (2.8%). Similar to age, a substantial portion of contacts were of unknown or not recorded race (35.0%).

Figure 5: Race

Donut chart titled “Race” showing the distribution of race categories.

Image long description: Donut chart titled “Race” showing the distribution of race categories. White represents 58.5 percent, Unknown represents 35.0 percent, Black or African American represents 3.7 percent, and Other Race represents 2.8 percent.

Concerns

The concern can be thought of as the reason for the response — why were CARE staff involved? CARE teams could record up to three concerns for each response (primary, secondary and tertiary concerns) because people often have multiple concurrent issues. The primary concern is based on the staff’s clinical impression of the predominant issue addressed during the contact. Secondary and/or tertiary concerns are contributing factors to the primary concern. For example, suicidal thoughts (also referred to as suicidal ideation) may be the primary concern for the call, with a secondary concern of trauma. Not all responses had secondary or tertiary concerns.

Figure 6 shows all primary concerns. The most common primary concern in 2024-2025 was suicidal ideation (17.1% of all CARE responses), followed by substance use/intoxication (15.4% of all CARE responses). Situational reactions are third (14.2%). Situational reactions are circumstances where the person’s behavior is driven by a reaction to a specific situational stressor rather than a mental illness or substance intoxication. Examples include a relationship breakup, failing a test, or being fired from a job. Situational reactions are often paired with underlying issues that make persons more vulnerable to behavioral or emotional dysregulation such that external events precipitate a crisis reaction. Medical issues were the fourth most common primary concern, at 12.6% of all responses (31 responses).

Figure 6: Primary Concern, All CARE Responses

Bar chart of primary concerns in CARE responses (n=246, Apr 2024–Mar 2025).

Image long description: Bar chart of primary concerns in CARE responses (n=246, Apr 2024–Mar 2025). Suicidal ideation (17.1%), substance use (15.4%), and situational reactions (14.2%) were top categories, while most other concerns each accounted for less than 13%.

Focusing on only the primary concern can tend to undercount some concerns that often co-occur with other concerns. Suicidal ideation, for example, is a primary concern in 17.1% of responses — but also appears as a secondary or tertiary concern in an additional 10.1% of responses, for a total of 27.2% of responses where suicidal ideation is recorded as any concern. Figure 7 shows the percent of all responses where each type of concern is listed as a primary, secondary or tertiary concern.

Figure 7: Any Concern, All CARE Responses

Horizontal bar chart titled “Any Concern: All CARE Responses, April 2024–March 2025” with 246 total responses.

Image long description: Horizontal bar chart titled “Any Concern: All CARE Responses, April 2024–March 2025” with 246 total responses. Each response may include up to three concerns, so percentages exceed 100 percent. The most frequently identified concern is suicidal ideation at 27.2 percent, followed by situational reaction at 21.1 percent, substance use at 17.5 percent, medical issue at 17.1 percent, trauma at 14.6 percent, and all other concerns combined at 14.6 percent. Additional concerns include personality disorder at 11.8 percent, behavioral issue at 10.6 percent, delusions at 10.2 percent, substance intoxication at 10.2 percent, psychosis at 9.3 percent, anxiety at 8.1 percent, depression at 5.7 percent, neurocognitive disorder at 5.3 percent, medication-related concern at 3.3 percent, aggression at 1.6 percent, unknown at 1.6 percent, and substance withdrawal at 1.2 percent.

The four most common concerns remain suicidal ideation, substance use, situational reactions and medical issues. Trauma, however, is now the fifth most common concern; when trauma is a concern, it is more often a secondary or tertiary concern to suicidal ideation.

Diversion and Outcomes

Diversions are noted by CARE when their intervention changed the outcome of the call. Diversion was not applicable in most CARE calls (93.1%). Diversion from higher levels of care or emergency mental health hold occurred in 6.5% of incidents. The low rate of diversion is likely related to dispatch protocols that were specifically designed to dispatch teams other than CARE when the incident was likely to require a higher level of care or police involvement.

The preferred outcome in mental or behavioral health crisis response is typically for the community member to remain in the community, which means the community member was not transported to a higher level of care. Remaining in the community has several advantages over hospital stays, including providing care in a less disruptive manner, improved recovery rates, easier access to support networks, lower health care costs and reduction of stigma.

Overall, more than half (52.0%) of CARE responses resulted in the person remaining in the community. More than one in five (23.2%) resulted in voluntary transport. CARE was unable to contact the person in 17.1% of responses. BPD arrested three people (1.2%) in responses with an initial CARE response requested. In two of these responses, BPD cancelled the CARE response because the party was wanted on a warrant. On the third, an intoxicated community member was charged with assault on an American Medical Response (AMR) paramedic and also had an outstanding warrant.

Referrals

Referrals to services were common. Referrals were made in 72.8% of responses. Community members could be referred for immediate treatment, or ongoing or future treatment. Community members could also be referred to both immediate and ongoing services. Table 2 shows these types of referrals, the definition of each and examples. The type of treatment referred to during CARE responses appears in Figure 8.

Table 2: Referral Types

Type of referralDefinitionExamples
Immediate treatmentEmergency or other care relevant to an acute behavioral health or medical concern
  • Hospital emergency department
  • The Walk-in Crisis Center
  • Detox
Ongoing or future treatmentNon-emergency service to be provided on an ongoing or future basis
  • Primary care physician
  • Private therapist
  • Boulder County Human Services

Figure 8: Referrals by type of treatment

A donut chart titled “Referrals by type of treatment.”

Image long description: A donut chart titled “Referrals by type of treatment.” Four segments are shown.  Most referrals were to both immediate and ongoing treatment (28% each), followed by no referral (27%), with immediate referrals least common (17%).

CARE referred community members to 22 different services. Some services were more commonly referred than others. Community members can be referred to multiple services, depending on their needs. The total number of referrals reported below therefore exceeds the number of incidents.

The most common referral was follow-up by CARE (37.4%), followed by the team’s case managers (27.6%). A referral back to CARE could mean that the clinician was going to follow up with that person by phone or in person, or it could mean that the team provided their contact information to someone on the call with an encouragement for them to reach out as needed. No referrals were made in just over a quarter of responses (27.2%). Table 3 shows the percent of CARE responses that resulted in a referral to each service.

Table 3: Percent of referrals by service, 2024-2025

Note: Community members can be referred to multiple services in one call for service; percentages sum to more than 100%.
Service

Percent of CARE responses

n=246

CARE

37.4%

Case management

28.0%

No referral made

27.2%

Walk In Crisis

23.6%

Emergency department

22.0%

Mental Health Partners

12.2%

Private therapist

11.0%

Homelessness resources

9.8%

Detox

8.5%

Private psychiatrist

8.5%

Other

6.9%

Substance use disorder services

2.4%

The Hope Institute

2.4%

Primary Care Provider

2.0%

Law enforcement/legal resources

1.6%

Adult Protective Services / Older adult services

1.2%

Boulder County Human Services

1.2%

CU Counseling Service (CAPS)

0.8%

Traumatic Brain Injury resources

0.8%

Intensive outpatient

0.4%

Case Management Caseloads

Case management consists of resource navigation, where persons are directed toward resources, and more intense active case management. Resource navigation is for persons who are high-functioning and able to access services independently, but who need referrals for low acuity concerns. Resource navigation clients may be able to meet their needs using existing services, but they could use some redirection or problem-solving during a period of crisis. Resource navigation clients may also not want more active case management but will accept resource navigation.

The most common needs addressed by resource navigation were mental health services (57.8%), benefits (36.4%) and housing (31.6%). Figure 9 shows the percent of all resource navigation sessions that addressed each need. More than one need can be addressed in a session. Just over 100 persons (103) received resource navigation services during the study period.

Figure 9: Needs Addressed by Case Management: Resource Navigation Clients

Bar chart titled “Needs Addressed by Case Management – Resource Navigation.”

Image long description: Bar chart titled “Needs Addressed by Case Management – Resource Navigation.”  Top categories were mental health services (57.8%), benefits (36.4%), and housing (31.6%), while transportation (5.9%) and educational/vocational services (2.7%) were least common.

Active case management clients receive more intensive coordination of services, typically over a longer time period. Case managers enroll clients into active case management when clients need more support to connect with service providers in the community and address their goals. Case managers meet with clients as often as needed. Thirty-nine people received these services over 460 sessions; some of these people also received resource navigation. The needs addressed for active case management clients were different from those of resource navigation clients. More than half (52%) of active case management clients received services related to needs not specifically listed (i.e., other needs), suggesting a broad array of needs addressed. Healthcare services (43.7%), benefits (38.3%) and mental health services (37.2%) were the next most common.

Figure 10: Needs Addressed by Case Management: Active Clients

Bar chart showing needs addressed by case management for active clients.

Image long description: Bar chart showing needs addressed by case management for active clients. Top categories were “Other” (52.0%), other healthcare services (43.7%), and benefits (38.3%), while substance use services (3.5%) and educational/vocational services (0.2%) were least common.

Summary

The Community Assistance Response and Engagement (CARE) pilot program represented one way Boulder can provide a non-police response to behavioral health crises. Launched in late 2023 as a partnership between Housing and Human Services (HHS), Boulder Fire-Rescue (BFR), Boulder Police Department (BPD) and Police and Fire Communications (BPFC), CARE paired licensed behavioral health clinicians with dedicated paramedics to provide a medical and clinical response outside of traditional law enforcement channels.

After refining dispatch protocols, over its first year of full implementation (April 2024 – March 2025), CARE completed 246 responses, serving at least 179 distinct individuals. CARE’s work focused on crisis intervention, clinical case management and referrals to community services. The majority of clients engaged only once, though a small number had multiple contacts. CARE’s most common concerns included suicidal ideation, substance use, situational stressors and medical issues, often in overlapping combinations.

Program outcomes suggest that CARE responses frequently enabled individuals to remain safely in the community, with over half of all responses ending without hospital or justice system involvement. Diversion rates were modest, largely reflecting the dispatch protocols that limited CARE’s deployment to lower-acuity incidents. Nevertheless, the program demonstrated that a carefully structured non-police response can resolve crises effectively and connect individuals to needed services. Referrals to additional supports were common (73% of responses), particularly to CARE, CARE case management and walk-in or emergency services.

Staff interviews underscored both the strengths and challenges of the pilot. Clinicians, paramedics and supervisors recognized that CARE offered an important alternative to police response and reduced barriers for community members who might otherwise avoid engaging with services. At the same time, differences in organizational culture, rigid dispatch protocols and low call volume contributed to inconsistent expectations across departments, complicating role clarity and leaving paramedics underutilized. These challenges highlight the importance of aligning program design, dispatch protocols and staffing models to the realities of community need.

Overall, the CARE pilot program showed promise as a complement to Boulder’s broader behavioral health response system. The pilot demonstrated that some crises can be resolved without police presence, but that identification of those incidents at the time of dispatch is difficult, given the inherent uncertainty often present during a behavioral health crisis. Low utilization of the paramedic’s skillset within CARE reflects how the program’s dispatch protocols and operational constraints limited opportunities to apply their clinical skillset. This observation relates specifically to the current CARE deployment model and should not be interpreted as a statement about the value or effectiveness of paramedics in other models. Future work should explore how a broader community paramedicine deployment model could leverage the full skillset of paramedics more effectively.

Our work in Boulder and best practices in behavioral health crisis response suggests that having a continuum of responses that involves interprofessional teams of police, behavioral health clinicians, case managers, paramedics and other healthcare professionals is likely to result in the best outcomes for members of the community. Often, the populations involved are difficult to serve, and flexible responses that allow team members to lean on the training and expertise of other team members as needed is crucial to success.

From our analysis of quantitative data and interviews with staff in Boulder, the key finding is that the number of 911 calls that can safely and practically be responded to without a police officer is too small to have resources solely dedicated to a non-police response modality. At the same time, the number of such calls is not zero — a non-police response should exist as one response modality available to the community. One option for this non-police response is a more flexible use of existing crisis team clinicians and case managers, which the City of Boulder has indicated it will pursue. As Boulder considers the future of crisis response, the CARE program’s early lessons provide a foundation for building a more responsive, collaborative and sustainable approach to behavioral health crisis intervention.

Appendix I: Acronyms Used

AMR: American Medical Response

BFR: Boulder Fire-Rescue

BPD: Boulder Police Department

BPFC: Boulder Police and Fire Communications

CARE: Community Assistance Response and Engagement

CIRT: Crisis Intervention Response Team

EDGE: Mental Health Partners Early Diversion Get Engaged

HHS: Housing and Human Services

IAED: International Academies of Emergency Dispatch

Appendix II: CARE Dispatch Process Maps

Flowchart illustrating how emergency calls involving behavioral health issues are processed.

Image long description: Flowchart illustrating how emergency calls involving behavioral health issues are processed. The chart begins with a box labeled “Behavioral Health Issue,” followed by a decision point asking whether a behavioral health indicator is mentioned or known by first-, second-, third-, or fourth-party callers. Examples of indicators listed include mental health crisis, anxiety or panic attack, depression, delusions, paranoia, hallucinations, or a diagnosed mental illness.

If no behavioral health indicator is identified, the call is routed to a welfare check card. If yes, the call is handled as an EMD call, followed by a decision point asking whether the call is coded as a CARE determinant. If the answer is no, recommended units are dispatched, and police are included if appropriate. If the call is coded as a CARE determinant, dispatch assesses whether a CARE unit is available. If available, the CARE unit is dispatched.

The diagram is a process map titled “Suicidal Person.” It describes how calls involving a suicidal person are routed for response.

Image long description: The diagram is a process map titled “Suicidal Person.” It describes how calls involving a suicidal person are routed for response.

All calls involving a suicidal person are handled as Emergency Medical Dispatch (EMD) calls, including calls from first-, second-, third-, and fourth-party callers. These calls are coded through EMD to determine whether CARE is identified as a determinant.

If CARE is not identified as a determinant, recommended response units are dispatched, and police are included if appropriate.

If CARE is identified as a determinant, the process asks whether a CARE unit is available. If a CARE unit is available, the CARE unit is dispatched. If a CARE unit is not available, recommended response units are dispatched, and police are included if appropriate.
 

The diagram is a process map titled “Welfare Check.” It describes how welfare check calls are screened and routed for response.

Image long description: The diagram is a process map titled “Welfare Check.” It describes how welfare check calls are screened and routed for response.

The process begins by determining whether the subject is armed or known to carry weapons, is violent or combative, is committing a crime, or is intoxicated due to alcohol or narcotics.

If the answer is yes, the process asks whether a behavioral health indicator is present or whether the caller is requesting mental health services. If yes, the call is coded as a behavioral health check and police are dispatched with a crisis intervention response team. If no, the call continues as a welfare check or is coded using the most appropriate alternative code.

If the subject is not armed, violent, committing a crime, or intoxicated, the process again asks whether a behavioral health indicator is present or whether the caller is requesting mental health services. If no, the call continues as a welfare check or is coded using the most appropriate alternative code.

If a behavioral health indicator is present or mental health services are requested, the call proceeds as an Emergency Medical Dispatch (EMD) call. The next decision asks whether the EMD codes identify CARE as a determinant.

If CARE is not identified as a determinant, recommended response units are dispatched, and police are included if appropriate.

If CARE is identified as a determinant, the process asks whether a CARE unit is available. If a CARE unit is available, the CARE unit is dispatched. If a CARE unit is not available, recommended response units are dispatched, and police are included if appropriate.

Appendix III: Data Tables for Charts

Figure 1: Left pane (Demand)

Time

Mon

Tue

Wed

Thu

Fri

Sat

Sun

0800-1159

3.9%

3.9%

3.8%

3.4%

1.2%

2.7%

1.9%

1200-1559

7.2%

5.1%

3.9%

3.4%

4.9%

3.6%

4.8%

1600-1959

3.2%

4.3%

3.8%

3.1%

3.1%

2.4%

1.7%

2000-2359

1.7%

2.0%

2.2%

2.7%

1.5%

1.4%

1.2%

0000-0359

1.2%

0.9%

0.5%

0.7%

1.0%

0.7%

1.2%

0400-0759

0.3%

0.7%

0.9%

0.7%

0.9%

1.2%

1.2%

Figure 1: Right pane (Responses)

Time

Mon

Tue

Wed

Thu

Fri

Sat

Sun

0800-1159

5.3%

4.9%

3.3%

2.0%

3.7%

2.8%

2.8%

1200-1559

11.8%

8.1%

6.9%

4.5%

7.3%

4.9%

7.7%

1600-1959

3.7%

5.3%

4.1%

2.8%

4.1%

2.0%

1.6%

2000-2359

0.0%

0.0%

0.0%

0.0%

0.0%

0.4%

0.0%

0000-0359

0.0%

0.0%

0.0%

0.0%

0.0%

0.0%

0.0%

0400-0759

0.0%

0.0%

0.0%

0.0%

0.0%

0.0%

0.0%

Figure 2: Total Monthly Hours on Calls for Service, CARE

Month

Total Hours

Apr 2024

9.0

May 2024

25.1

Jun 2024

13.1

Jul 2024

18.8

Aug 2024

29.7

Sep 2024

30.3

Oct 2024

26.5

Nov 2024

23.9

Dec 2024

15.0

Jan 2025

25.3

Feb 2025

19.0

Mar 2025

18.5

Figure 3: Gender

GenderPercentage of CARE responses
Female

40.2%

Male

39.0%

Transgender

3.7%

Unknown

17.1%

Figure 4: Age

AgePercentage of CARE responses
Under 18

3.7%

18-24

8.5%

25-34

10.6%

35-44

12.6%

45-54

10.6%

55-64

14.2%

65-74

9.8%

75-88

6.9%

89 and older

1.2%

Unknown

22.0%

Figure 5: Race

RacePercentage of CARE responses
White58.5%
Unknown35.0%
Black or African American3.7%
Other Race2.8%

Figure 6: Primary Concern, All CARE Responses

ConcernNumberPercent
Suicidal Ideation

42

17.1%
Substance Use

38

15.4%
Situational Reaction

35

14.2%
Medical Issue

31

12.6%
Behavioral Issue

20

8.1%
Delusions

14

5.7%
Personality Disorder

10

4.1%
Neurocognitive Disorder

9

3.7%
Psychosis

8

3.3%
Trauma

7

2.8%
Anxiety

6

2.4%
All other concerns

26

10.6%

Figure 7: Any Concern, All CARE Responses

Concern

Percent of responses

Suicidal Ideation

27.2%

Situational Reaction

21.1%

Substance Use

17.5%

Medical Issue

17.1%

Trauma

14.6%

Personality Disorder

11.8%

Behavioral Issue

10.6%

Delusions

10.2%

Substance Intoxication

10.2%

Psychosis

9.3%

Anxiety

8.1%

Depression

5.7%

Neurocognitive Disorder

5.3%

Medication

3.3%

Aggression

1.6%

Unknown

1.6%

Substance Withdrawal

1.2%

All other

14.6%

Note: multiple concerns can be present on a single call; column sums to more than 100%

Figure 8: Referrals by Type of Treatment

Type of treatment

Percent of responses

Immediate

17.5%

Ongoing

27.6%

Both Immediate and Ongoing

27.6%

No referral made

27.2%

Figure 9: Needs Addressed by Case Management: Resource Navigation Clients

Service

Percent of resource navigation clients

Mental Health Services

57.8%

Benefits

36.4%

Housing

31.6%

Other

28.3%

Other Healthcare Services

23.0%

Outreach/Engagement

21.9%

Social Needs

16.0%

Legal Services

11.2%

Substance Use Services

10.2%

Transportation

5.9%

Educational/Vocational Services

2.7%

Figure 10: Needs Addressed by Case Management: Active Clients

Need

Percentage of needs addressed

Other

52.0%

Other Healthcare Services

43.7%

Benefits

38.3%

Mental Health Services

37.2%

Housing

29.8%

Outreach/Engagement

27.4%

Transportation

18.9%

Legal Services

7.8%

Social Needs

6.7%

Substance Use Services

3.5%

Educational/Vocational Services

0.2%