First Quarter, 2025 City of Boulder Revenue Report

This report provides information and analysis related to 2025 unaudited taxes and fees including sales and use tax, accommodations tax, admissions tax, disposable bag fee, electronic smoking device tax, food service tax, marijuana tax, short-term rental tax, sugar sweetened beverage tax, and the trash tax.

The revenue reported below was received by the city through April 2025 and is largely attributed to economic activity through the month of March.

Details by industry, geographic area and month are found further along in this report, in addition to the Exhibits 1-3.

Table 1 - Sales and Use Tax Summary

Table 1 part 1 - Sales and Use Tax Related to Current Economic Activity
Sales and Use Tax Related
to Current Economic Activity

YTD
March 2024

YTD
March 2025

Change
in Value

YTD
% Change

12 Month
% Change

Sales Tax

31,990,031

32,032,814

42,784

0.13%

1.27%

Rec MJ Additional 3.5%

284,840

251,614

-33,225

-11.66%

-17.82%

Business Use Tax

2,467,593

2,751,344

283,751

11.50%

-12.78%

Construction Use Tax

4,934,982

6,113,327

1,178,345

23.88%

29.98%

Motor Vehicle Use Tax

1,605,713

1,611,833

6,120

0.38%

3.78%

Total Sales & Use Tax from Current Economic Activity

$41,283,159

$42,760,934

$1,477,775

3.58%

2.48%

Table 1 part 2 - Sales and Use Tax Related to Prior Periods
Sales and Use Tax
Related to Prior Periods

YTD
March 2024

YTD
March 2025

Change
in Value

YTD
% Change

12 Month
% Change

Sales Tax Audit Revenue

147,950

802,297

654,347

442.28%

1718.16%

Use Tax Audit Revenue

140,042

62,390

-77,651

-55.45%

-1636.61%

Total Sales and Use Tax

$41,571,151

$43,625,620

$2,054,470

4.94%

4.64%

Table 2 - Other Tax & Fee Revenues

Miscellaneous
Revenue Statistics

YTD
March 2024

YTD
March 2025

Change
in Value

YTD
% Change

12 Month
% Change

Accommodations Tax

1,396,930

1,352,864

-44,065

-3.15%

3.97%

Admissions Tax

94,121

82,439

-11,683

-12.41%

59.92%

Disposable Bag Fee

83,805

48,913

-34,892

-41.64%

-33.95%

Electronic Smoking Device Tax

137,299

83,842

-53,457

-38.93%

-20.49%

Food Service Tax

168,731

227,511

58,780

34.84%

22.56%

Rec Marijuana Excise Tax

32,870

51,603

18,733

56.99%

-63.48%

Short-Term Rental Tax

397,329

481,099

83,770

21.08%

45.18%

Sugar Sweetened Beverage Tax

1,015,095

1,248,580

233,485

23.00%

1.86%

Trash Tax

429,379

456,164

26,785

6.24%

2.00%

Revenue Trends and Changes

Overview

March YTD sales and use tax based upon current economic activity were up compared to March 2024, by approximately $1.478 million or 3.6%.

The city also completes tax compliance audits which may result in additional revenue. This revenue relates to prior periods and is not reflective of current economic activity. Including audit revenue, total sales and use tax increased from YTD March 2024 by $2.054 million or 4.9%. The sales and use tax increases were driven by gains in more volatile revenue sources such as business use tax, construction use tax, and audit revenue categories.

Sales Tax

YTD March 2025 sales tax (including audit revenue and the additional 3.5% recreational marijuana tax) increased by $663,917 (or 2.1%) when compared to YTD March 2024, primarily due to strength in industries such as Automotive Trade, Computer Related Business Sector, Eating Places, Transportation/Utilities, and increases in the All-Other category. This increase results in a compound annual growth rate of 5.3% compared to 2020. The chart below illustrates the trend in sales tax revenue over the past six years. Much of this growth in sales tax is attributable to the adoption of the Marketplace Facilitator ordinance in late 2020.

Line chart showing Total Sales Tax Revenue from 2020 to 2025, with values rising from $25.5 million in 2020 to $33.1 million in 2025, including a notable increase between 2022 and 2023.

The performance for Sales Tax by industry was mixed, with the gains coming from five business sectors: Automotive Trade (up 1.7%), Computer Related Business (up 20.0%), Eating Places (up 1.2%), Transportation/Utilities (up 0.2%), and All-Other (up 25.3%). The All-Other category is derived from taxpayer-provided NAICS codes that do not generally fit within the other reported categories and may include revenues that were previously reported in another industry code, such as General Retail. Notably, General Retail declined 7.4% in part due to the migration of revenues to the All-Other category based upon changes in business-provided NAICS data. The twelve-month change for March sales tax of 2.6% outpaced the Consumer Price Index (CPI) for All Urban Consumers of 2.4% as reported by the U.S. Bureau of Labor Statistics, April 10, 2025.

Other Taxes

Short-Term Rental tax increased 21.1%, Accommodations Tax decreased 3.2%, and Admissions Tax decreased by 12.4%. Marijuana taxes were mixed with the additional 3.5% tax on Recreational Marijuana decreasing by 11.7% and Recreational Marijuana Excise Tax increasing 57.0%. Disposable Bag Fee decreased 41.6%. The city’s Electronic Smoking Device tax decreased by 38.9% and the Sugar-Sweetened Beverage tax increased by 23.0%.

Chart 1: Year-to-Date Sales and Use Tax Revenue by Fund

Pie chart showing year-to-date sales and use tax revenue allocation by fund.  The General Fund is the largest segment at 47% ($20.4M), followed by Open Space & Mountain Parks at 20% ($8.7M), Transportation at 19% ($8.4M), Community Culture & Safety at 8% ($3.4M), Parks & Recreation at 6% ($2.8M) and Art, Culture, and Heritage at 2% ($843K).

Chart 2: Year-to-Date Sales & Use Tax Revenue by Type

Pie chart showing YTD Sales & Use Tax by Type, with Sales Tax as the dominant segment at 73% ($32.1M), followed by Construction Use Tax at 14% ($6.1M), Business Use Tax at 6% ($2.8M), Motor Vehicle Use Tax at 4% ($1.6M), Sales Tax Audit Revenue at 2% ($802K), Recreational Marijuana Additional 3.5% at 1% ($252K), and Use Tax Audit Revenue at 0% ($62K).

Retail Sales Tax

  • Retail sales tax including Recreational Marijuana additional sales tax and sales tax audit revenue comprises approximately 76% of total sales and use tax revenue for the period.

  • Because there is strong seasonality to retail sales tax revenue, it is useful to compare same month-over-month revenue changes. March 2025 retail sales tax revenue increased 3.4% compared to March 2024 revenue (including audit revenue and the additional recreational marijuana sales tax).

Chart 3: Month-Over-Month Change in Retail Taxable Sales

Vertical bar chart showing month-over-month change in retail taxable sales from 2022-2025, with April 2022 showing the highest growth at nearly 30%, April 2023 showing the largest decline at about -7%, and most other months displaying positive single-digit growth rates.  Exhibit 3 contains details by period in table form.

Chart 4: Sales Tax by Industry

Pie chart showing Sales Tax by Industry, with General Retail as the largest segment at 18.4%, followed by Food Stores at 15.4%, All Other at 15.0%, Computer Related Business Sector at 13.1%, Eating Places at 12.9%, Transportation/Utilities at 7.7%, and smaller segments including Automotive Trade (5.0%), Apparel Stores (2.8%), Building Material-Retail (2.8%), Consumer Electronics (2.7%), Home Furnishings (1.8%), Recreational Marijuana (1.4%), Construction Sales/Use Tax (0.9%), and Medical Marijuana (0.0%).

Chart 5: Sales Tax by Geographic Area

Some geographic sub-areas have been combined, see Exhibit 2 for breakdowns.

Pie chart showing Sales Tax by Geographic Area, with Out of State as the largest segment at 29.1%, followed by BVRC-Bldr Valley Regional Center at 19.8%, Downtown at 9.6%, Colorado All Other at 6.9%, Public Utilities at 5.0%, Boulder Industrial at 4.9%, All Other Boulder at 4.9%, N. 28th St Commercial at 4.5%, 29th Street at 3.6%, Gunbarrel at 2.7%, Table Mesa at 1.9%, Basemar at 1.8%, University of Colorado at 1.5%, North Broadway at 1.5%, The Meadows at 1.3%, UHGID ("the hill") at 1.0%, and Airport at 0.0

Chart 6: Industry Trends – YTD Retail Sales Tax

The chart below highlights the three highest grossing industries in the time series, omitting the All-Other category. Combined these industries generate nearly half of total retail sales tax revenue for the period. Totals may not tie to exhibits due to rounding.

Line chart showing sales tax trends from 2022 to 2025 for three industry categories: General Retail (green line) declining from $7.6M to $6.1M, Food Stores (orange line) remaining relatively stable around $4.8M-$5.1M, and Eating Places (blue line) gradually increasing from $3.7M to $4.3M.

Chart 7: Geographic Area Trends – YTD Retail Sales Tax

The chart below highlights the three-highest grossing geographic areas in the time series. Combined these three areas generate over half of total retail sales tax revenue for the period. Notes: Downtown includes Pearl Street Mall, Downtown, Downtown Extension, and East Downtown. Totals may not tie to exhibits due to rounding.

Line chart showing sales tax revenue trends from 2022 to 2025 for three geographic areas: Out of State (green line) steadily increasing from $8.0M to $9.9M, BVRC-Boulder Valley Regional Center (blue line) remaining relatively stable around $6.0M-$6.7M, and Downtown (orange line) growing significantly from $1.4M to $3.3M.

Marijuana Tax Revenues

Marijuana Tax Overview

The City of Boulder collects revenue from the sale of both medical and recreational marijuana. The city collects the base 3.86% sales and use tax on medical and recreational marijuana. The city also collects an additional 3.50% sales and use tax on recreational marijuana, and a 5.0% excise tax when marijuana is transferred from a cultivation facility to a dispensary, testing facility or facility that produces marijuana infused products. The additional sales and excise taxes are dedicated to the General Fund. The city also receives a revenue share-back from state recreational marijuana taxes, which is reflected in Chart 8 below.

Chart 8: Distribution of YTD Marijuana Revenues

Distribution of YTD Marijuana Revenues pie chart. $303,080, followed by Recreational Marijuana (3.86% Base) at $235,586, State Share-Back at $45,759, and Medical Marijuana (3.86% Base) at $10,212.

Chart 9: Historical Trends for YTD Marijuana Revenues Excluding State Share-Back

2022 numbers have been revised to correct a reporting error that understated Rec Marijuana and overstated All Other.

Line chart showing Historical Trends for YTD Marijuana Revenues Excluding State Share-Back from 2022 to 2025, with Grand Total (green line) declining from $1.25M to $549K, Recreational Marijuana (orange line) dropping from $1.20M to $539K, and Medical Marijuana (blue line) decreasing from $51K to $10K.

City Tax Descriptions

Accommodations Tax

This tax is charged for the leasing or renting of any room, hotel/motel room, or other public accommodation located in the city and used for overnight lodging purposes (for less than a 30-night stay). The current accommodations tax rate is 7.5%.

Admissions Tax

This tax is charged for admission to an event such as concerts, nightclubs, and theatres. The tax rate for admission to an event is 5.0% of the price of the ticket or admission. Any admission fee paid or charged to participate in a racing event which includes running, walking, biking, or swimming is exempt from this tax.

Business Use Tax

Use tax applies to all furniture, fixtures, equipment, supplies, and materials purchased for use by businesses that are not for resale. If a person or business hasn’t paid the proper city sales tax to the vendor on a taxable purchase, they must report use tax directly to the city. The current City of Boulder use tax rate is 3.86%.

Construction Use Tax

Construction Use Tax is paid at the time of a building permit application and is based upon 50% of the valuation of the project. If the project valuation is more than $75,000, after the project is complete the contractor is required to file a reconciliation return to determine whether additional tax is due, or a refund is due based upon the actual value of taxable personal property and services included in project. This tax is therefore dependent upon the number and value of construction projects permitted in a year and can vary significantly year to year, and because it is collected at the time of permitting the revenue is in advance of visible construction activity. The current construction use tax rate is 3.86%.

Disposable Bag Fee

The city requires a 10-cent fee on all disposable plastic and paper checkout bags provided by stores in Boulder. The bag fee does not apply to certain types of disposable bags including those provided by restaurants, bulk or produce bags, newspaper bags, or any other kind of food packaging bags. The city council intends that the requirements of the bag fee imposition will assist in offsetting the costs associated with using disposable bags including mitigation, educational, replacement, and administrative efforts of the city.

Electronic Smoking Device Tax

This additional 40% sales tax is applied to the retail sales price of Electronic Smoking Devices (ESDs) containing nicotine including any refill, cartridge, or any other component of such product. This tax is in addition to the city’s 3.86% sales and use tax levied on the sale of ESDs.

Food Service Tax

This tax is applied to food and beverage sold in or by food service establishments. The food service tax of 0.15% is added to the current sales tax rate of 3.86% resulting in a total tax rate of 4.01%. This tax is not applied to food purchased for home consumption from grocery/convenience stores.
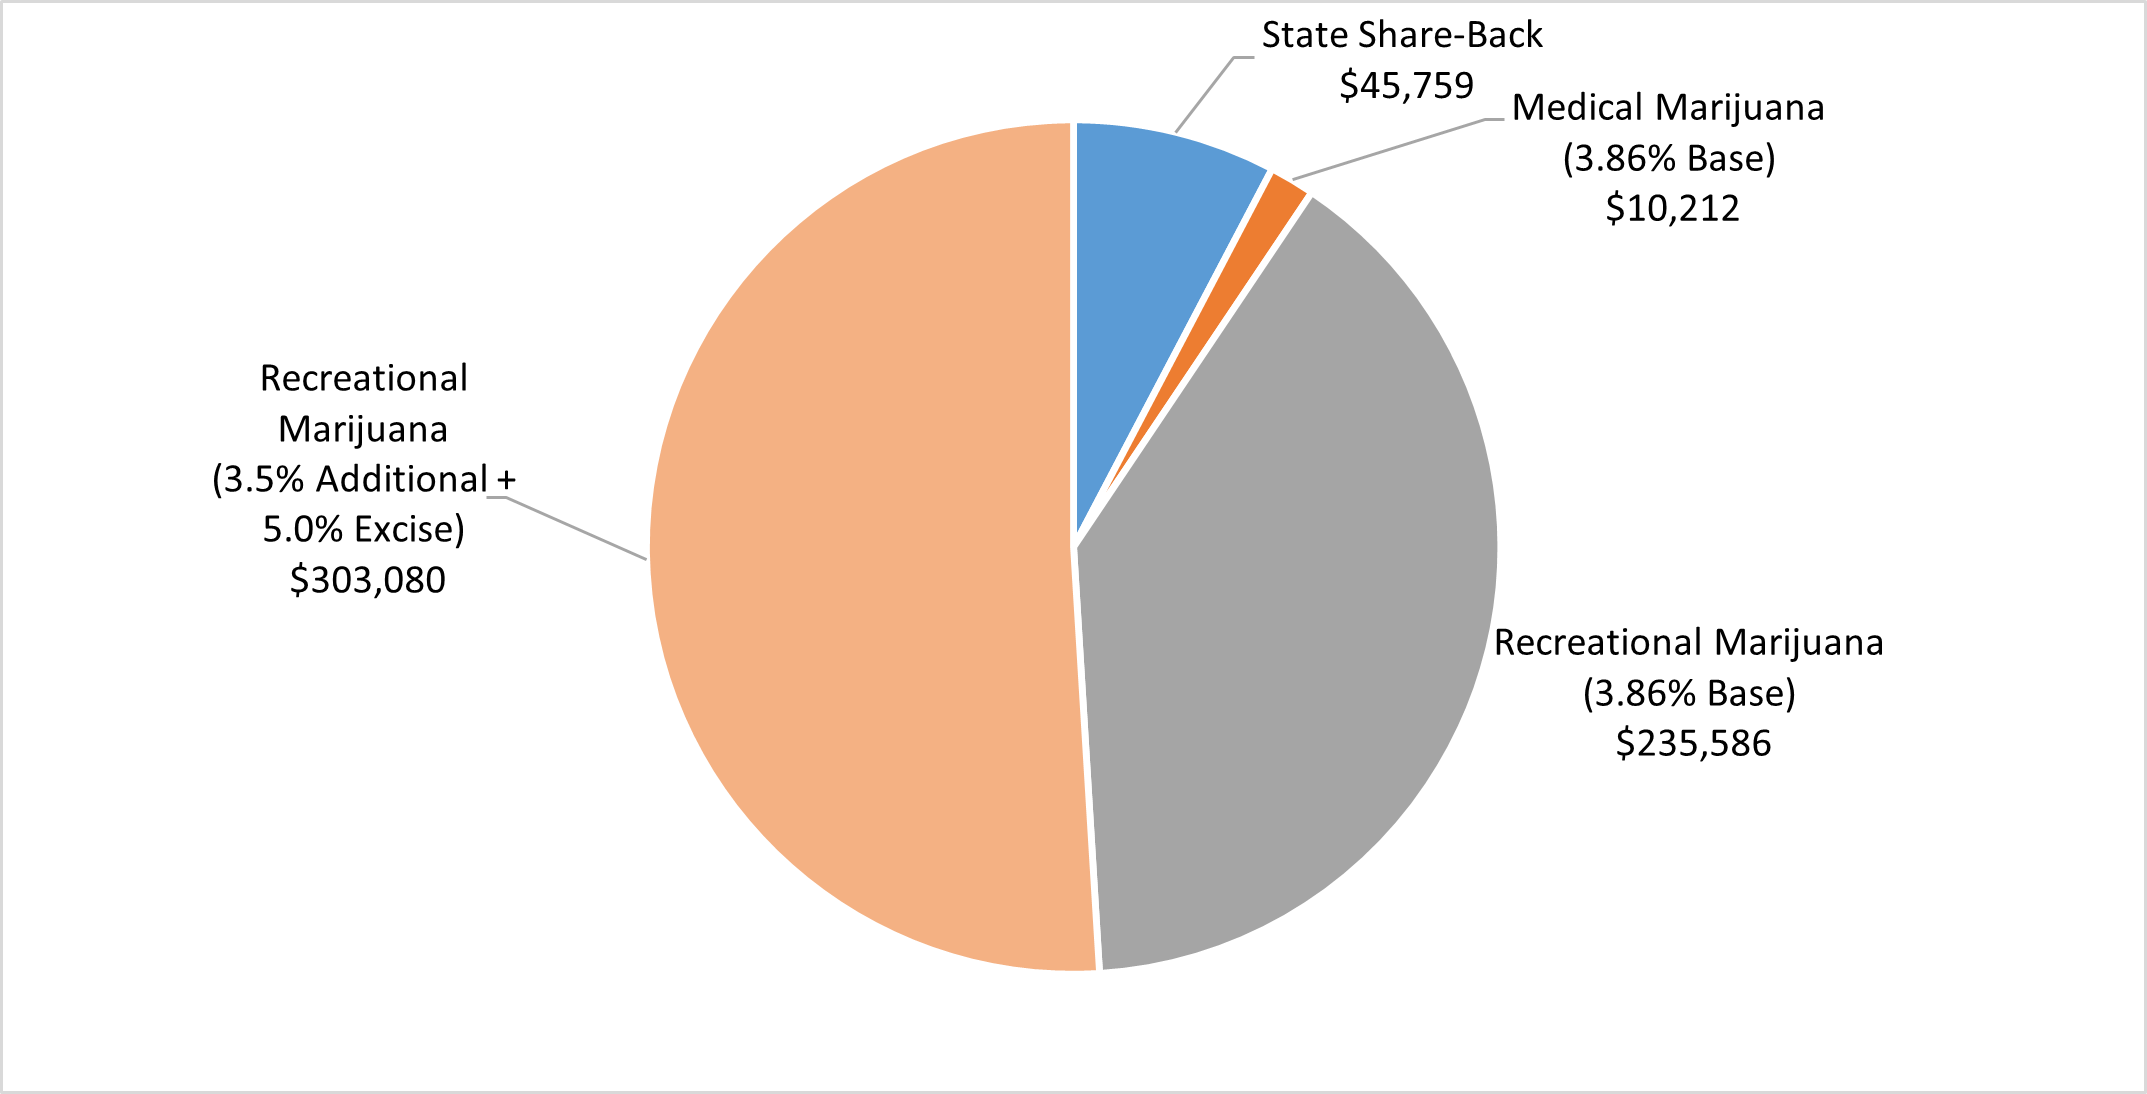
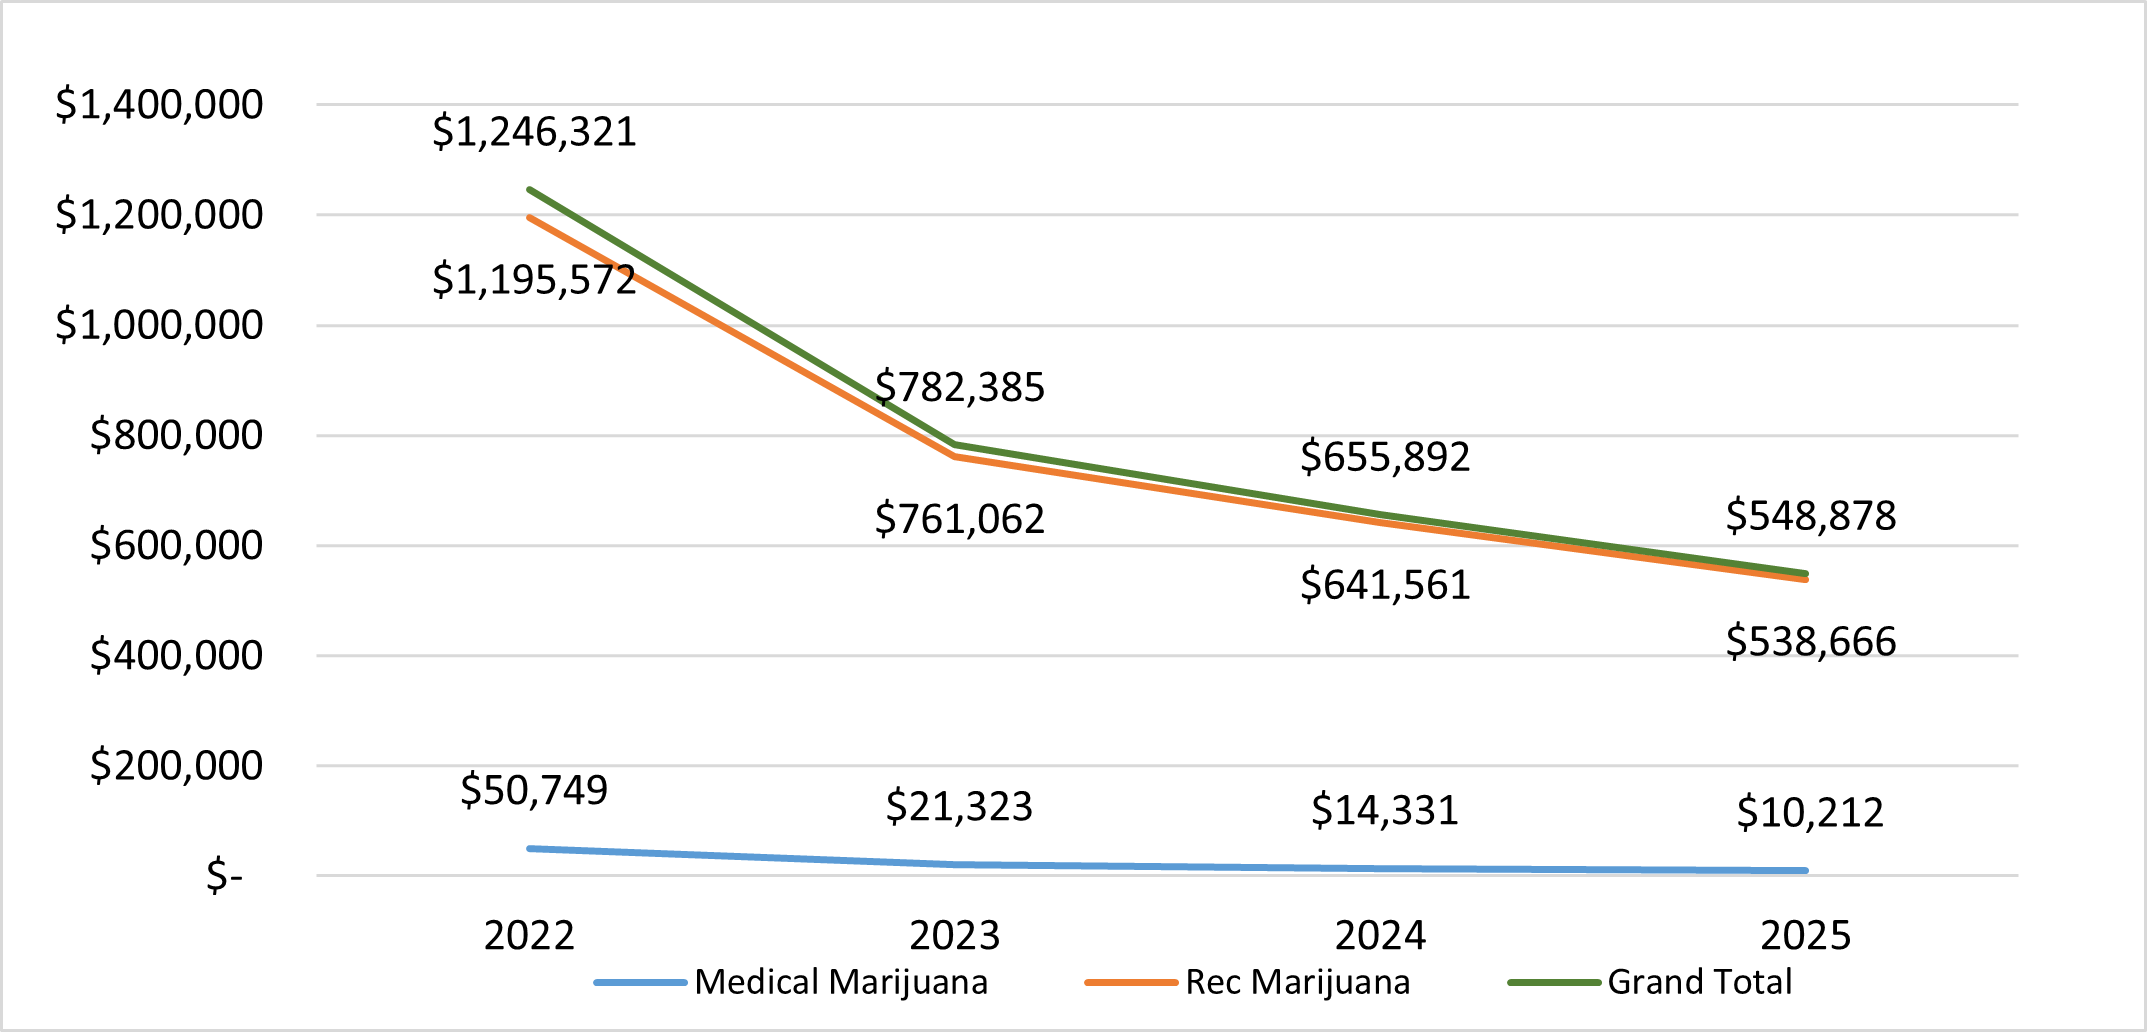
Marijuana Taxes

The city’s 3.86% sales tax applies to the sale of both medical and recreational marijuana. In addition, the city has a 3.5% additional recreational marijuana tax and 5.0% excise tax on the transfer of marijuana from a recreational marijuana cultivation facility to a marijuana infused product facility, testing facility or recreational marijuana store. In addition, the city receives a revenue share back from state recreational marijuana taxes.

Motor Vehicle Use Tax

If sales tax is not paid at the time of purchasing a vehicle, a Motor Vehicle Use Tax is due at the time a vehicle is registered or titled to an address within the city. The current use tax rate is 3.86%.

Short Term Rental Tax

This tax is charged for leasing or renting properties by Boulder homeowners for less than 30 days at a time. The current short-term rental tax rate is 7.5%.

Sugar Sweetened Beverage Product Distribution Tax

The Sugar Sweetened Beverage Product Distribution Tax is a voter-initiated tax that was adopted by Boulder voters in the November 2016 election. It places a 2-cent per ounce excise tax on the distribution of beverages with added sugar and other sweeteners. Revenue will be spent on health promotion, general wellness programs and chronic disease prevention that improve health equity, and other health programs (especially for residents with low income and those most affected by chronic disease) linked to sugary drink consumption.

Trash Tax

The trash tax is an occupation tax on trash haulers serving customers within the city limits and helps fund waste reduction efforts in Boulder. Most haulers pass the tax on to customers as part of their trash service bills. Boulder also has a waste hauling ordinance that applies to all haulers. The current trash tax rates are $3.50 per month for households and $0.85 per cubic yard of trash for businesses and multifamily units that use centralized dumpsters.

Exhibit 1: Sales and Use Tax by Category, Industry and Location

Total Net Sales/Use Tax
Receipts by Category

YTD
March 2024

YTD
March 2025

% of
Total

YTD
% Change

12 Month
% Change

Sales Tax

32,422,808

33,086,725

75.84%

2.05%

2.60%

Business Use Tax

2,607,648

2,813,735

6.45%

7.90%

-0.30%

Construction Use Tax

4,934,982

6,113,327

14.01%

23.88%

29.98%

Motor Vehicle Use Tax

1,605,713

1,611,833

3.69%

0.38%

3.78%

Total Sales and Use Tax

$41,571,151

$43,625,620

100.00%

4.94%

4.64%

Total Net Sales/Use Tax
Receipts by Industry Type

YTD
March 2024

YTD
March 2025

% of
Total

YTD
% Change

12 Month
% Change

Apparel Stores

1,174,983

933,761

2.14%

-20.53%

2.84%

Automotive Trade

3,256,416

3,297,845

7.56%

1.27%

7.24%

Building Material - Retail

1,036,186

937,800

2.15%

-9.50%

-8.09%

Computer Related Business Sector

3,982,498

4,652,800

10.67%

16.83%

-10.02%

Construction Sales / Use Tax

5,467,358

6,384,632

14.64%

16.78%

26.53%

Consumer Electronics

947,667

914,902

2.10%

-3.46%

10.32%

Eating Places

4,239,522

4,278,987

9.81%

0.93%

7.37%

Food Stores

5,229,400

5,228,844

11.99%

-0.01%

-0.39%

General Retail

6,752,699

6,183,045

14.17%

-8.44%

-11.10%

Home Furnishings

619,616

608,398

1.39%

-1.81%

-8.48%

Medical Marijuana

14,331

10,212

0.02%

-28.74%

-56.59%

Rec Marijuana

608,691

487,063

1.12%

-19.98%

-18.87%

Transportation/Utilities

2,627,594

2,655,124

6.09%

1.05%

7.11%

All Other

5,614,189

7,052,207

16.17%

25.61%

33.80%

Total Sales and Use Tax

$41,571,151

$43,625,620

100.00%

4.94%

4.64%

Total Net Sales/Use Tax
Receipts by Geographic Area

YTD
March 2024

YTD
March 2025

% of
Total

YTD
% Change

12 Month
% Change

29th Street

1,527,454

1,259,828

2.89%

-17.52%

-6.94%

Airport

50,200

26,068

0.06%

-48.07%

-40.05%

Basemar

636,755

637,924

1.46%

0.18%

2.37%

Boulder County

555,092

422,339

0.97%

-23.92%

1.43%

Boulder Industrial

3,423,879

3,956,518

9.07%

15.56%

5.23%

BVRC-Boulder Valley Regional Center

6,237,995

8,453,114

19.38%

35.51%

2.42%

Colorado All Other

188,181

235,277

0.54%

25.03%

21.25%

County Clerk

1,605,713

1,611,833

3.69%

0.38%

3.78%

Downtown

2,324,040

2,624,367

6.02%

12.92%

0.91%

Downtown Extension

26,210

56,981

0.13%

117.40%

-10.17%

East Downtown

222,326

164,078

0.38%

-26.20%

1.02%

Gunbarrel Commercial

426,370

362,536

0.83%

-14.97%

-5.39%

Gunbarrel Industrial

1,287,991

1,551,662

3.56%

20.47%

27.78%

Metro Denver

1,857,243

1,815,421

4.16%

-2.25%

6.12%

N. 28th St Commercial

1,957,548

1,567,618

3.59%

-19.92%

7.64%

N. Broadway Annex

88,058

143,856

0.33%

63.36%

112.20%

North Broadway

462,757

470,689

1.08%

1.71%

-1.48%

Out of State

8,897,173

10,014,242

22.95%

12.56%

7.91%

Pearl Street Mall

846,018

794,874

1.82%

-6.05%

2.36%

Public Utilities

1,724,273

1,796,370

4.12%

4.18%

7.65%

Table Mesa

719,926

645,704

1.48%

-10.31%

5.93%

The Meadows

333,084

-430,278

-0.99%

-229.18%

-43.98%

UHGID (the "hill")

333,568

384,407

0.88%

15.24%

12.01%

University of Colorado

3,173,770

1,252,422

2.87%

-60.54%

1.92%

Unlicensed Receipts

-20,342

148,038

0.34%

827.74%

12.97%

All Other Boulder

2,685,868

3,659,730

8.39%

36.26%

4.63%

Total Sales and Use Tax

$41,571,151

$43,625,620

100.00%

4.94%

4.64%

Notes for Geographic Trends: The Meadows reflects a negative value due to the reallocation of revenues caused by an address change. The BVRC growth is impacted by this reallocation.

Exhibit 2: Sales Tax and Use Tax Separately by Industry and Location

Sales Tax
by Industry

YTD
March 2024

YTD
March 2025

Change
in Value

YTD
% Change

12 Month
% Change

Apparel Stores

1,172,871

927,092

-245,779

-20.96%

2.46%

Automotive Trade

1,633,604

1,661,365

27,761

1.70%

10.49%

Building Material - Retail

1,030,292

935,295

-94,997

-9.22%

-8.10%

Computer Related Business Sector

3,606,694

4,328,639

721,945

20.02%

-6.51%

Construction Sales / Use Tax

368,107

313,016

-55,091

-14.97%

25.49%

Consumer Electronics

897,086

882,850

-14,236

-1.59%

-3.34%

Eating Places

4,222,986

4,271,921

48,935

1.16%

7.58%

Food Stores

5,175,120

5,096,934

-78,186

-1.51%

-0.77%

General Retail

6,578,206

6,089,647

-488,559

-7.43%

-8.77%

Home Furnishings

617,338

604,835

-12,503

-2.03%

-8.53%

Medical Marijuana

14,293

10,212

-4,082

-28.56%

-55.48%

Rec Marijuana

605,168

486,476

-118,692

-19.61%

-18.90%

Transportation/Utilities

2,539,955

2,545,912

5,957

0.23%

8.25%

All Other

3,961,087

4,932,530

971,443

24.52%

40.87%

Total Sales Tax by Industry

$32,422,808

$33,086,725

$663,917

2.05%

2.60%

Use Tax
by Industry

YTD
March 2024

YTD
March 2025

Change
in Value

YTD
% Change

12 Month
% Change

Apparel Stores

2,112

6,670

4,557

215.74%

107.23%

Automotive Trade

1,622,812

1,636,479

13,667

0.84%

3.84%

Building Material - Retail

5,894

2,505

-3,389

-57.50%

-6.60%

Computer Related Business Sector

375,804

324,160

-51,644

-13.74%

-29.99%

Construction Sales / Use Tax

5,099,251

6,071,616

972,365

19.07%

26.62%

Consumer Electronics

50,581

32,052

-18,529

-36.63%

382.20%

Eating Places

16,535

7,066

-9,470

-57.27%

-28.07%

Food Stores

54,280

131,910

77,630

143.02%

44.62%

General Retail

174,493

93,399

-81,094

-46.47%

-63.04%

Home Furnishings

2,278

3,563

1,285

56.39%

4.70%

Medical Marijuana

38

0

-38

-100.00%

-95.53%

Rec Marijuana

3,523

586

-2,936

-83.35%

-13.25%

Transportation/Utilities

87,639

109,212

21,573

24.62%

-14.39%

All Other

1,653,102

2,119,677

466,575

28.22%

19.20%

Total Use Tax by Industry

$9,148,343

$10,538,895

$1,390,552

15.20%

13.44%

Sales Tax
by Location

YTD
March 2024

YTD
March 2025

Change
in Value

YTD
% Change

12 Month
% Change

29th Street

1,480,037

1,216,054

-263,983

-17.84%

-7.28%

Airport

25,854

15,719

-10,134

-39.20%

-49.50%

Basemar

629,960

620,120

-9,840

-1.56%

-3.98%

Boulder County

398,330

399,494

1,164

0.29%

16.26%

Boulder Industrial

1,786,441

1,667,275

-119,166

-6.67%

12.86%

BVRC-Boulder Valley Regional Center

6,064,950

6,733,703

668,753

11.03%

-0.28%

Colorado All Other

179,426

227,406

47,980

26.74%

15.04%

County Clerk

0

0

0

0.00%

0.00%

Downtown

2,189,431

2,298,530

109,098

4.98%

0.76%

Downtown Extension

12,747

14,616

1,869

14.67%

-44.90%

East Downtown

210,026

150,870

-59,155

-28.17%

-14.63%

Gunbarrel Commercial

425,575

368,111

-57,464

-13.50%

-4.91%

Gunbarrel Industrial

536,958

547,013

10,056

1.87%

-21.01%

Metro Denver

1,747,706

1,726,489

-21,217

-1.21%

6.50%

N. 28th St Commercial

1,553,753

1,515,703

-38,050

-2.45%

-5.69%

N. Broadway Annex

83,469

94,362

10,893

13.05%

6.47%

North Broadway

427,038

399,305

-27,732

-6.49%

-3.82%

Out of State

8,759,129

9,875,673

1,116,544

12.75%

8.55%

Pearl Street Mall

798,024

810,164

12,140

1.52%

5.15%

Public Utilities

1,663,041

1,713,694

50,652

3.05%

8.49%

Table Mesa

717,677

640,469

-77,208

-10.76%

5.74%

The Meadows

328,395

-433,979

-762,374

-232.15%

-49.41%

UHGID (the "hill")

314,478

339,054

24,576

7.81%

7.90%

University of Colorado

509,781

515,920

6,139

1.20%

29.16%

Unlicensed Receipts

1,620

-20,438

-22,058

-1361.53%

-18.82%

All Other Boulder

1,578,963

1,651,398

72,435

4.59%

5.36%

Total Sales Tax by Location

$32,422,808

$33,086,725

$663,917

2.05%

2.60%

Use Tax
by Location

YTD
March 2024

YTD
March 2025

Change
in Value

YTD
% Change

12 Month
% Change

29th Street

47,417

43,774

-3,643

-7.68%

3.59%

Airport

24,346

10,349

-13,998

-57.49%

-31.93%

Basemar

6,795

17,804

11,009

162.03%

324.75%

Boulder County

156,762

22,846

-133,916

-85.43%

-49.63%

Boulder Industrial

1,637,438

2,289,243

651,804

39.81%

-1.44%

BVRC-Boulder Valley Regional Center

173,045

1,719,412

1,546,366

893.62%

69.49%

Colorado All Other

8,754

7,871

-883

-10.09%

158.30%

County Clerk

1,605,713

1,611,833

6,120

0.38%

3.78%

Downtown

134,608

325,838

191,229

142.06%

2.49%

Downtown Extension

13,463

42,365

28,902

214.68%

7.47%

East Downtown

12,300

13,207

907

7.37%

94.17%

Gunbarrel Commercial

795

-5,575

-6,370

-801.36%

-84.15%

Gunbarrel Industrial

751,034

1,004,649

253,615

33.77%

86.57%

Metro Denver

109,537

88,932

-20,605

-18.81%

-2.33%

N. 28th St Commercial

403,796

51,915

-351,881

-87.14%

320.20%

N. Broadway Annex

4,589

49,494

44,905

978.52%

-297.58%

North Broadway

35,719

71,383

35,664

99.85%

24.09%

Out of State

138,045

138,570

525

0.38%

-21.96%

Pearl Street Mall

47,995

-15,289

-63,284

-131.86%

-99.43%

Public Utilities

61,232

82,676

21,444

35.02%

-7.36%

Table Mesa

2,249

5,235

2,986

132.78%

63.10%

The Meadows

4,689

3,701

-988

-21.08%

52.84%

UHGID (the "hill")

19,090

45,354

26,264

137.58%

384.95%

University of Colorado

2,663,989

736,502

-1,927,487

-72.35%

-11.01%

Unlicensed Receipts

-21,962

168,476

190,438

-867.11%

272.62%

All Other Boulder

1,106,905

2,008,332

901,427

81.44%

3.76%

Total Use Tax by Location

$9,148,343

$10,538,895

$1,390,552

15.20%

13.44%

Exhibit 3: Sales Tax and Use Tax Separately by Month

This table presents historical taxes by type. Please contact sales tax staff at 303-441-3051 or salestax@bouldercolorado.gov for a screen readable version.

REVENUE
CATEGORY

YEAR

JAN

FEB

MAR

APR

MAY

JUN

JUL

AUG

SEP

OCT

NOV

DEC

TOTAL

TAXABLE
SALES

% Change in
Taxable Sales

Tax Rate

Retail Sales Tax

2020

7,761,028

7,370,943

10,025,017

$25,156,988

$651,735,453

-2.06%

3.86

2021

8,059,343

7,608,759

10,351,245

$26,019,347

$674,076,347

3.43%

3.86

2022

9,592,143

9,009,882

11,376,046

$29,978,071

$776,633,964

15.21%

3.86

2023

10,246,130

9,156,111

12,665,356

$32,067,597

$830,766,761

6.97%

3.86

2024

10,556,772

9,223,353

12,642,682

$32,422,808

$839,969,120

1.11%

3.86

2025

10,474,622

9,543,082

13,069,022

$33,086,725

$857,169,052

2.05%

3.86

Change from prior year (month)

-0.78%

3.47%

3.37%

Change from prior year (YTD)

-0.78%

1.20%

2.05%

Business Use Tax

2020

654,578

1,384,693

903,331

$2,942,602

$76,233,225

0.10%

3.86

2021

1,093,683

922,423

1,358,876

$3,374,982

$87,434,767

14.69%

3.86

2022

801,989

796,506

1,338,778

$2,937,273

$76,095,155

-12.97%

3.86

2023

923,424

711,000

1,607,058

$3,241,481

$83,976,200

10.36%

3.86

2024

849,584

620,114

1,137,950

$2,607,648

$67,555,636

-19.55%

3.86

2025

976,045

663,963

1,173,727

$2,813,735

$72,894,686

7.90%

3.86

Change from prior year (month)

14.89%

7.07%

3.14%

Change from prior year (YTD)

14.89%

11.59%

7.90%

Construction Use Tax

2020

182,837

810,198

1,463,531

$2,456,566

$63,641,594

-9.38%

3.86

2021

1,015,642

810,738

776,246

$2,602,626

$67,425,544

5.95%

3.86

2022

1,405,836

1,491,714

1,289,094

$4,186,644

$108,462,280

60.86%

3.86

2023

1,528,238

1,835,363

848,775

$4,212,376

$109,128,905

0.61%

3.86

2024

1,135,899

1,476,736

2,322,348

$4,934,982

$127,849,284

17.15%

3.86

2025

2,603,396

2,858,452

651,479

$6,113,327

$158,376,351

23.88%

3.86

Change from prior year (month)

129.19%

93.57%

-71.95%

Change from prior year (YTD)

129.19%

109.06%

23.88%

Motor Vehicle Use Tax

2020

459,561

416,162

277,748

$1,153,470

$29,882,634

-13.72%

3.86

2021

553,658

539,761

477,063

$1,570,482

$40,686,062

36.15%

3.86

2022

489,417

405,726

646,263

$1,541,406

$39,932,798

-1.85%

3.86

2023

534,029

425,121

500,637

$1,459,786

$37,818,301

-5.30%

3.86

2024

614,611

466,478

524,624

$1,605,713

$41,598,775

10.00%

3.86

2025

526,493

586,134

499,206

$1,611,833

$41,757,333

0.38%

3.86

Change from prior year (month)

-14.34%

25.65%

-4.84%

Change from prior year (YTD)

-14.34%

2.92%

0.38%

TOTAL

2020

9,058,004

9,981,996

12,669,627

$31,709,626

$821,492,906

-2.95%

3.86

2021

10,722,326

9,881,681

12,963,430

$33,567,437

$869,622,720

5.86%

3.86

2022

12,289,385

11,703,828

14,650,181

$38,643,394

$1,001,124,197

15.12%

3.86

2023

13,231,820

12,127,595

15,621,826

$40,981,240

$1,061,690,167

6.05%

3.86

2024

13,156,866

11,786,681

16,627,604

$41,571,151

$1,076,972,816

1.44%

3.86

2025

14,580,556

13,651,630

15,393,434

$43,625,620

$1,130,197,422

4.94%

3.86

Change from prior year (month)

10.82%

15.82%

-7.42%

Change from prior year (YTD)

10.82%

13.18%

4.94%