About the Popular Annual Financial Report

As a part of an ongoing commitment to transparency and helping ensure community access to information about its local government the City of Boulder provides this Popular Annual Financial Report (PAFR), which describes the city's financial activities and position in 2023. This is a summary of information reported in the city's 2023 Annual Comprehensive Financial Report (ACFR).

While the ACFR is prepared in accordance with generally accepted accounting principles, the PAFR is not. The ACFR is a more detailed, audited document of record, and it presents information in a format consistent with this standard to ensure it includes detailed information including the city's component units, presents individual funds in detail, and fully discloses all material events, both financial and nonfinancial. By contrast, the purpose of the PAFR is to increase public awareness about the city's financial condition by presenting information in a more user-friendly format and is unaudited and not presented in accordance with general accepted accounting principles.

The city's website also includes a wealth of information about the activities of city departments; job opportunities; budgets; council members, agendas and meetings; community events; and much more.
Quick Facts about Boulder

  • Population: 108,000
  • Unemployment rate: 3.3%
  • Sales and use tax rate: 3.86%
  • City employees: 1,546
  • City operating budget: $355 million
  • City capital budget: $161 million

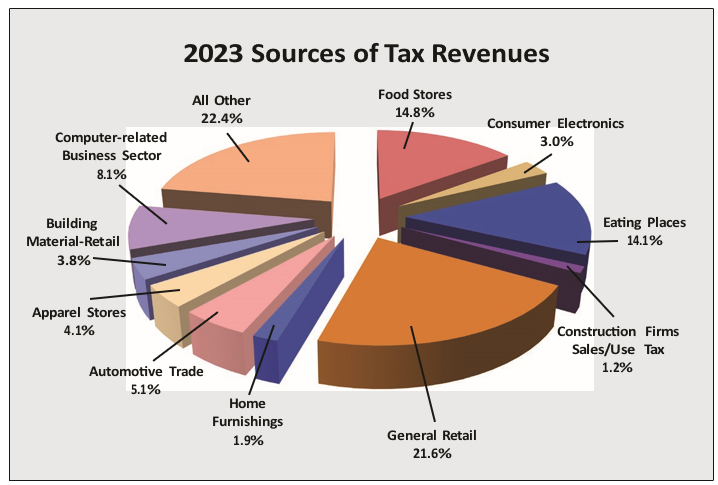
Pie chart breakdown of tax revenue sources for 2023, with each sector's contribution represented as a percentage of total tax revenues.

This pie chart shows the breakdown of tax revenue sources for 2023, with each sector's contribution represented as a percentage of total tax revenues.

The largest contributors are:

All Other (22.4%) - the biggest single category

General Retail (21.6%) - nearly as large as "All Other"

Food Stores (14.8%) - representing grocery and food retail

Eating Places (14.1%) - restaurants and food service establishments

Mid-sized contributors include:

Computer-related Business Sector (8.1%)

Automotive Trade (5.1%)

Apparel Stores (4.1%)

Building Material-Retail (3.8%)

The smallest contributors are:

Consumer Electronics (3.0%)

Home Furnishings (1.9%)

Construction Firms Sales/Use Tax (1.2%)

The data reveals that retail sectors (General Retail, Food Stores, and Eating Places) collectively account for about half of all tax revenues at 50.5%. This suggests the tax structure is heavily dependent on consumer spending and retail activity, which makes sense for sales tax or similar consumption-based revenue systems.