While the Annual Comprehensive Financial Report (ACFR) is prepared in accordance with generally accepted accounting principles, the Popular Annual Financial Report (PAFR) is not. The ACFR is a more detailed, audited document of record, and it presents information in a format consistent with this standard to ensure it includes detailed information including the city’s component units, presents individual funds in detail, and fully discloses all material events, both financial and non-financial. By contrast, the purpose of the PAFR is to increase public awareness about the city’s financial condition by presenting information in a more user-friendly format and is unaudited and not presented in accordance with general accepted accounting principles.
Introduction
As a part of an ongoing commitment to transparency and helping ensure community access to information about its local government the City of Boulder provides this Popular Annual Financial Report (PAFR), which describes the city’s financial activities and position in 2024. This is a summary of information reported in the city’s 2024 Annual Comprehensive Financial Report (ACFR).
About the Popular Annual Financial Report
Quick Facts about Boulder
| Metric | Value |
|---|---|
| Population | 106,083 |
| Unemployment rate | 4.0% |
| Sales and use tax rate | 3.86% |
| City employees | 1,508 |
| City operating budget | $374 million |
| City capital budget | $141 million |
Top 6 City of Boulder Employers
Over 2,000 employees: University of Colorado, Ball Corporation, Boulder Valley School District, St. Vrain Valley School District, Boulder Community Health, and Boulder County.
Other Major Employers
IBM Corporation, National Center for Atmospheric Research, University Corporation for Atmospheric Research, National Oceanic & Atmospheric Administration, and City of Boulder.
Significant 2024 City Events
The following is a summary of significant events during the year that affected the City of Boulder’s financial position.
- Started up new high service pumps and electrical system upgrades as part of a $30 million capital upgrade to the water treatment facility on 63rd Street, near Boulder Reservoir.
- Continued significant progress on three critical flood mitigation projects: specifically South Boulder Creek Phase 1, Gregory Canyon Creek, and Upper Goose Creek and Twomile Canyon Creek.
- Celebrated the completion and opening of the new clubhouse, ProShop and public restrooms at Flatirons Golf Course. The project added a valuable community gathering space, improved energy efficiency, and included installing EV charging stations and redesigning the parking lot to improve accessibility.
- In 2024, assisted 1,035 households facing a potential eviction, which is a 29% increase from 2023. 96% of the cases were resolved without eviction. In addition, the city provided $186,957 in direct rental assistance to 77 households.
- Removed over 118 tons of debris from public spaces through 1,000+ clean-ups citywide via the Safe and Managed Public Spaces Program (SAMPS).
- Began construction along 19th Street in north Boulder to improve flood mitigation and multimodal transportation for all travelers, including building a new bicycle and pedestrian underpass connecting Tamarack Avenue to Upland Avenue and replacing and widening the 19th Street bridge over Fourmile Canyon Creek.
- Finished construction for the first protected intersection in the city along with an underpass at 30th Street and Colorado Avenue, providing important safety, accessibility, mobility and drainage improvements to the intersection.
- Completed the purchase of over 4,400 streetlights from Xcel Energy. The plan is to convert the lights to more efficient LEDs in 2025. This long-awaited move will save money, improve reliability, enhance safety and reduce carbon emissions.
- Awarded approximately $1.2 million through multiple Colorado Department of Transportation funding sources to purchase a battery electric bus, supporting the city’s current HOP bus fleet of electric and non-electric buses, reducing emissions, and supporting travel operations with an all-electric, emissions-free bus.
- Joined regional partners to secure nearly $1 billion in federal and utility funding that will be invested in building decarbonization (energy efficiency improvements and heat pump adoption) in the region over the next 5 years.
- Strengthened the city’s partnership with Boulder Small Business Development Center (SBDC) by hiring staff as city employees and offering IT and operational support to expand services for small businesses.
2024 Projects

1 of 8

2 of 8

3 of 8

A Community Risk Reduction Specialist conducts a Detailed Home Assessment on the property of a homeowner in the City of Boulder. These Boulder Fire-Rescue specialists work with property owners to make their homes and properties more wildfire resilient by conducting an assessment that suggests improvements for the home and property.
4 of 8

5 of 8

A person biking on the Baseline Road bike lane next to tall curbs with mural art.
6 of 8

7 of 8

Jack Sasson
8 of 8


Operating Indicators and Statistics
| Service Category and Metric | 2024 | 2023 |
|---|---|---|
| Public Works | ||
| Daily vehicle miles in Boulder Valley | 2.25 mil | 2.85 mil |
| Utilities | ||
| Water accounts | 29,550 | 28,992 |
| Gallons of water consumed daily | 15.7 mil | 14.3 mil |
| Public Safety | ||
| Police officers | 191 | 191 |
| Traffic accidents | 2,820 | 2,759 |
| Police calls for service | 101,883 | 97,698 |
| Firefighters | 123 | 113 |
| Fire responses | 15,278 | 14,751 |
| Fire responses within 6 minutes | 70% | 74% |
| Parks and Recreation | ||
| Acres of Open Space & Mountain Parks | 46,683 | 46,683 |
| Acres of urban parks | 1,861 | 1,861 |
| Recreation center attendance | 491,130 | 380,389 |
| Reservoir attendance | 117,902 | 121,624 |
| Planning and Development Services | ||
| Building permit applications | 7,085 | 7,038 |
| Zoning enforcement actions | 1,019 | 1,011 |
| Municipal Court | ||
| Traffic violations | 4,173 | 3,356 |
Financial Statements
Within the Annual Report, the city presents two different types of financial statements.
- The government-wide financial statements are designed to provide readers with a long-term overview of the city’s finances. These statements include the Statement of Net Position and the Statement of Activities. The government-wide financial statements distinguish functions of the city that are principally supported by taxes and intergovernmental revenues (governmental activities) from other functions that are intended to recover all or a significant portion of their costs through user fees and charges (business-type activities). Governmental activities encompass general government, administrative, public safety, public works including streets and transportation, planning and development, culture and recreation, open space and mountain parks, housing and human services and property and facility acquisition services. Business-type activities of the city include the water and wastewater utilities, stormwater and flood management and parking facilities.
- The fund financial statements provide a short-term perspective of individual funds.
Component Units
From a financial perspective the City of Boulder must report on the activities of two component units or areas of financial health:
- Primary government, which consists of all the funds and departments legally included within the city organization.
- Component units, which are legally separate organizations from the city, but for which the city is still financially accountable.
The financial information of the city’s component units is blended with the primary government and reported in the same manner as any other city operation.
City of Boulder Component Units
- Downtown Commercial District and University Hill Commercial District — These districts provide parking facilities and services and are administered by the City Council.
- Boulder Municipal Property Authority — The authority is a nonprofit organization responsible for the acquisition and construction of certain city properties and facilities and is administered by the City Council.
- Boulder Junction Access General Improvement District — This district is tasked with implementation of the transit-oriented development goals of shared, unbundled parking and travel demand management programs.
Statement of Net Position — Government-wide
The Government-wide Balance Sheet, known as the Statement of Net Position, presents information about the city’s assets and deferred outflows of resources as well as its liabilities and deferred inflows of resources, with the difference reported as net position. Deferred outflows and inflows of resources represent expenses and revenues that will be recognized in a future period. Over time, increases or decreases in net position may serve as a useful indicator of whether the financial position of the city is improving or deteriorating. The accompanying table of net position presents a summary of the city’s assets, deferred outflows of resources, liabilities, deferred inflows of resources, and net position at the end of 2024, 2023 and 2022. The city’s assets exceeded its liabilities by $1.81 billion at Dec. 31, 2024. The largest portion of the city’s net position, $1.4 billion (74 percent) reflects its investment in capital assets (i.e., land, buildings, infrastructure, machinery and equipment, utility plants, and underground drainage facilities), net of related debt. The city uses these capital assets to provide services to the public; consequently, these assets are not available to fund current operations. An additional portion of the city’s net position, $125.9 million (8 percent), denotes resources that are subject to usage restrictions. The remaining unrestricted balance of net position, $305.5 million (18 percent), may be used to meet the city’s ongoing obligations.
| Net Position at December 31 over the last three years (in thousands) | 2024 | 2023 | 2022 |
|---|---|---|---|
| Current and Other Assets | $ 713,690 | $ 675,957 | $ 668,615 |
| Capital Assets | 1,624,518 | 1,466,241 | 1,373,044 |
| Total Assets | 2,338,208 | 2,142,198 | 2,041,659 |
| Deferred Outflows of Resources | 49,969 | 65,012 | 21,334 |
| Liabilities | |||
| Noncurrent Liabilities | 453,234 | 388,576 | 278,876 |
| Other Liabilities | 52,863 | 65,123 | 64,540 |
| Total Liabilities | 506,097 | 453,699 | 343,416 |
| Deferred Inflows of Resources | 69,457 | 72,793 | 146,339 |
| Net Position | |||
| Invested in Capital Assets | 1,381,239 | 1,250,595 | 1,190,868 |
| Restricted | 125,926 | 137,427 | 129,294 |
| Unrestricted | 305,458 | 292,696 | 253,076 |
| Total Net Position | $ 1,812,623 | $ 1,680,718 | $ 1,573,238 |
Statement of Activities — Government-wide
The Government-wide Income Statement, known as the Statement of Activities, details the money received and spent by the city during the fiscal year.
Revenues — Where the money comes from . . .
The City of Boulder receives revenue from a variety of sources, described below.
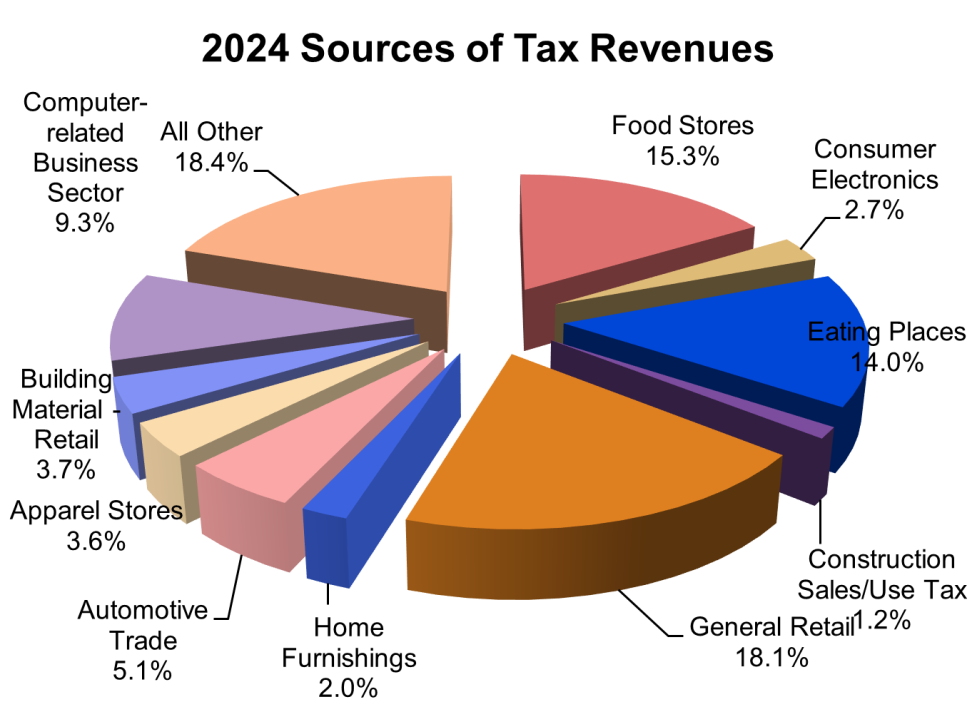
Sales, Use and Other Taxes are the city’s largest source of revenues and are collected on retail sales and other business activity. The $1.8 million decrease in 2024 compared to 2023 was due to a decline in construction use tax collections in 2024.
Property Taxes are collected by Boulder County and remitted to the city, less county fees. The $12.0 million increase in 2024 compared to 2023 was due to a large increase in property tax valuations and resulting assessments.
Other Taxes include accommodation, occupation, specific ownership, tobacco and excise taxes. Other taxes increased $0.4 million in 2024, primarily due to consistent consumer spending.
Charges for Services are payments received directly by the city for services performed. These revenues include parking charges, utility service charges and licensing fees. In 2024, charges for services increased $12.4 million due to an increase in utility fees.
Operating Grants are resources received from external entities and are generally restricted to finance one or more specific projects. In 2024, operating grants increased by $4.7million primarily due to a grant award for the Modular Factory project and spending related to the American Rescue Plan (ARPA).
Capital Grants and Contributions received by the city are used to purchase, construct or renovate specific capital assets. Capital grants increased $12.1 million when compared to 2023 due to the increased spending in CDOT funded transportation projects.
Interest Revenues are earned on the city’s fixed income investments. In 2024, interest revenues increased $1.2 million from 2023. This was due to increased yields on portfolio investments.
Other Revenues are derived from a variety of sources including insurance proceeds, legal settlements and gains on sales of capital assets. Other revenues increased $15.7 million in 2024 mainly due to a one-time payment from the Boulder Public Library district for facility and operating expense reimbursements pursuant to the separation agreement.
| Revenues by Source for the Year Ended December 31 over the last three years (in thousands) | 2024 | 2023 | 2022 |
|---|---|---|---|
| Sales, Use and Other Taxes | $ 176,403 | $ 178,213 | $ 171,335 |
| Property Taxes | 63,310 | 51,273 | 53,398 |
| Other Taxes | 36,932 | 36,492 | 33,591 |
| Charges for Services | 146,063 | 133,620 | 137,289 |
| Operating Grants | 25,363 | 20,668 | 17,180 |
| Capital Grants | 21,230 | 9,096 | 12,443 |
| Interest | 25,929 | 24,748 | (11,172) |
| Other | 20,418 | 4,670 | 7,974 |
| Total Revenues | $ 515,648 | $ 458,780 | $ 422,038 |

Expenses — Where the money goes . . .
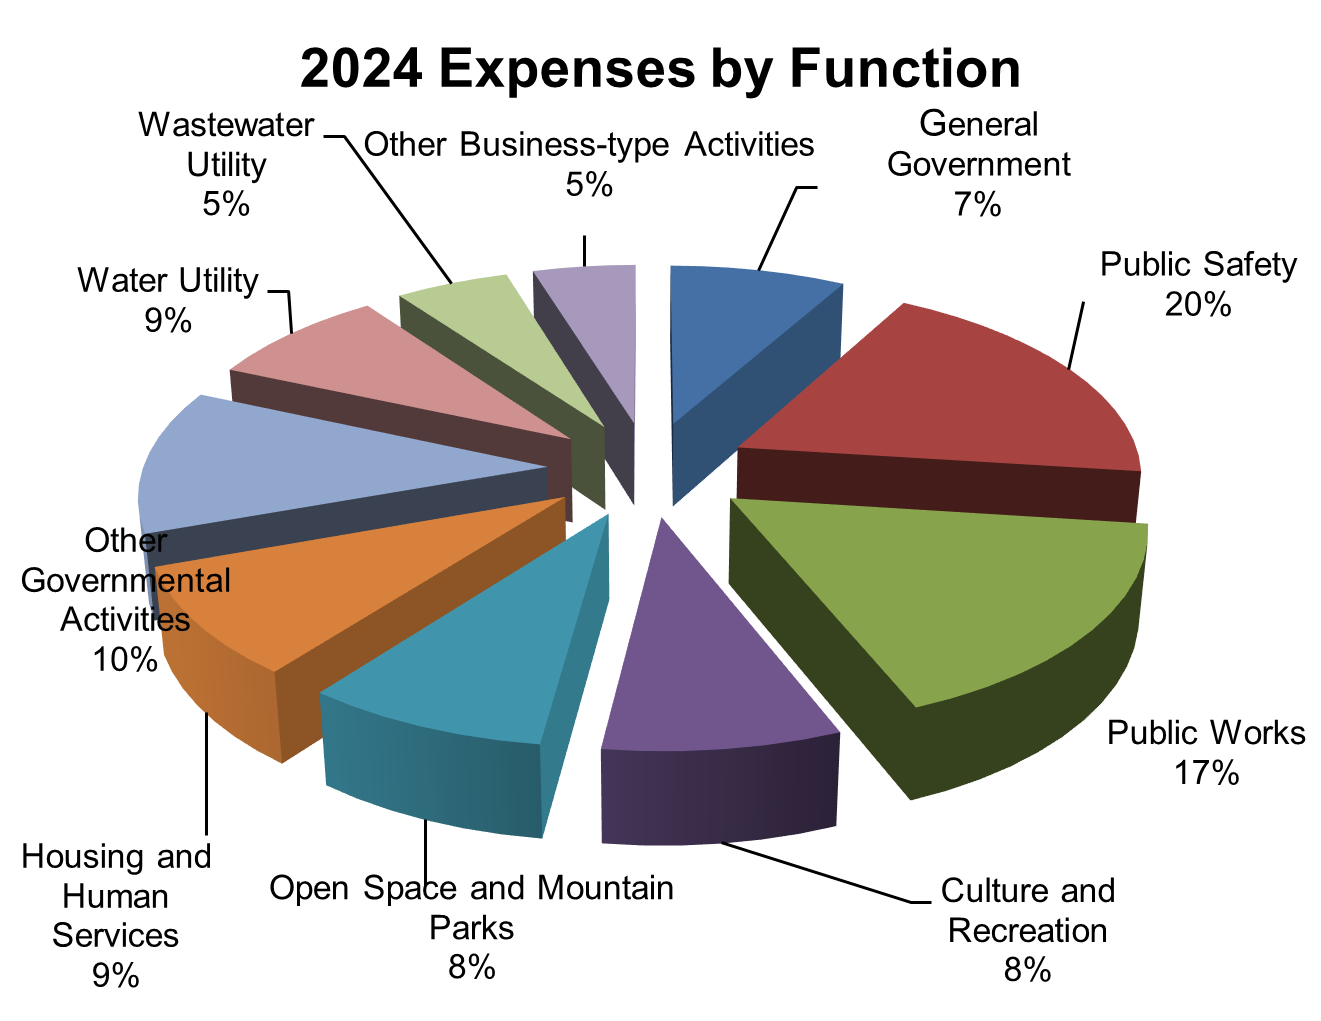
The city uses the revenue it receives to provide a variety of services to the community. A description of the city’s expenses by function is provided below.
The General Government function decreased by $0.9 million from 2023 to 2024 mainly due to cost savings and operational efficiencies from 2023 to 2024.
Public Safety includes both the police and fire departments. In 2024, Public Safety expenses increased $13.9 million. This increase was primarily due to an increase in salaries and wages and capital purchases in 2024.
Public Works comprises of costs associated with the repair, construction, acquisition and maintenance of public roads, bike paths and other city assets. Public Works expenses increased $10.2 million in 2024 primarily due to an increase in spending related to major capital projects.
Culture and Recreation includes the operating costs of parks and senior services. Costs associated with these services decreased $3.0 million in 2024 due to the completion of the Flatirons Golf Course improvements in 2023.
Open Space and Mountain Parks represents the cost of land acquisition, land restoration and trails management. Costs associated with these services increased $1.8 million in 2024 due to an increase on spending for trail improvements.
Housing and Human Services provides affordable housing and community services. Expenses increased $6.9 million due to an increase in capital expenditures related to department projects such as property acquisition and Modular Factory construction.
Other Governmental Activities include planning and development services, administrative services, and interest on long-term debt. In 2024, expenses increased $3.3 million mainly due to the Workday Financials implementation and grants awarded to the community.
Waterand Wastewater Utility mainly comprises the operating costs of these utilities, including annual upgrades and maintenance of water, wastewater, sewer lines and treatment plants. Operating expenses in these funds remained consistent from 2023 to 2024.
Other Business-type Activities consists of flood management, parking facilities, and property and facility acquisition services. Expenses in these activities remained consistent in 2024 with the exception of the flood management and property and facility acquisition. In 2024, flood management operating expenses decreased $2.9 million due to the completion of capital projects in 2023. Property and facility acquisition operating expenses increased by $8.8 million in 2024. This is due to increased expenditures related to the construction of new fire stations and other city facilities.
| Expenses by Function at December 31 over the last three years (in Thousands) | 2024 | 2023 | 2022 |
|---|---|---|---|
| General Government | $ 31,167 | $ 32,078 | $ 19,718 |
| Public Safety | 72,550 | 58,655 | 65,023 |
| Public Works | 64,996 | 54,807 | 42,098 |
| Culture and Recreation | 31,111 | 34,078 | 32,035 |
| Open Space and Mountain Parks | 32,033 | 30,225 | 22,916 |
| Housing and Human Services | 34,876 | 27,990 | 20,458 |
| Other Governmental Activities | 46,320 | 43,068 | 25,808 |
| Water Utility | 32,349 | 30,599 | 26,358 |
| Wastewater Utility | 20,143 | 17,980 | 17,299 |
| Other Business-type Activities | 18,198 | 21,820 | 17,324 |
| Total Expenses | $ 383,743 | $ 351,300 | $ 289,037 |
Governmental Fund Highlights
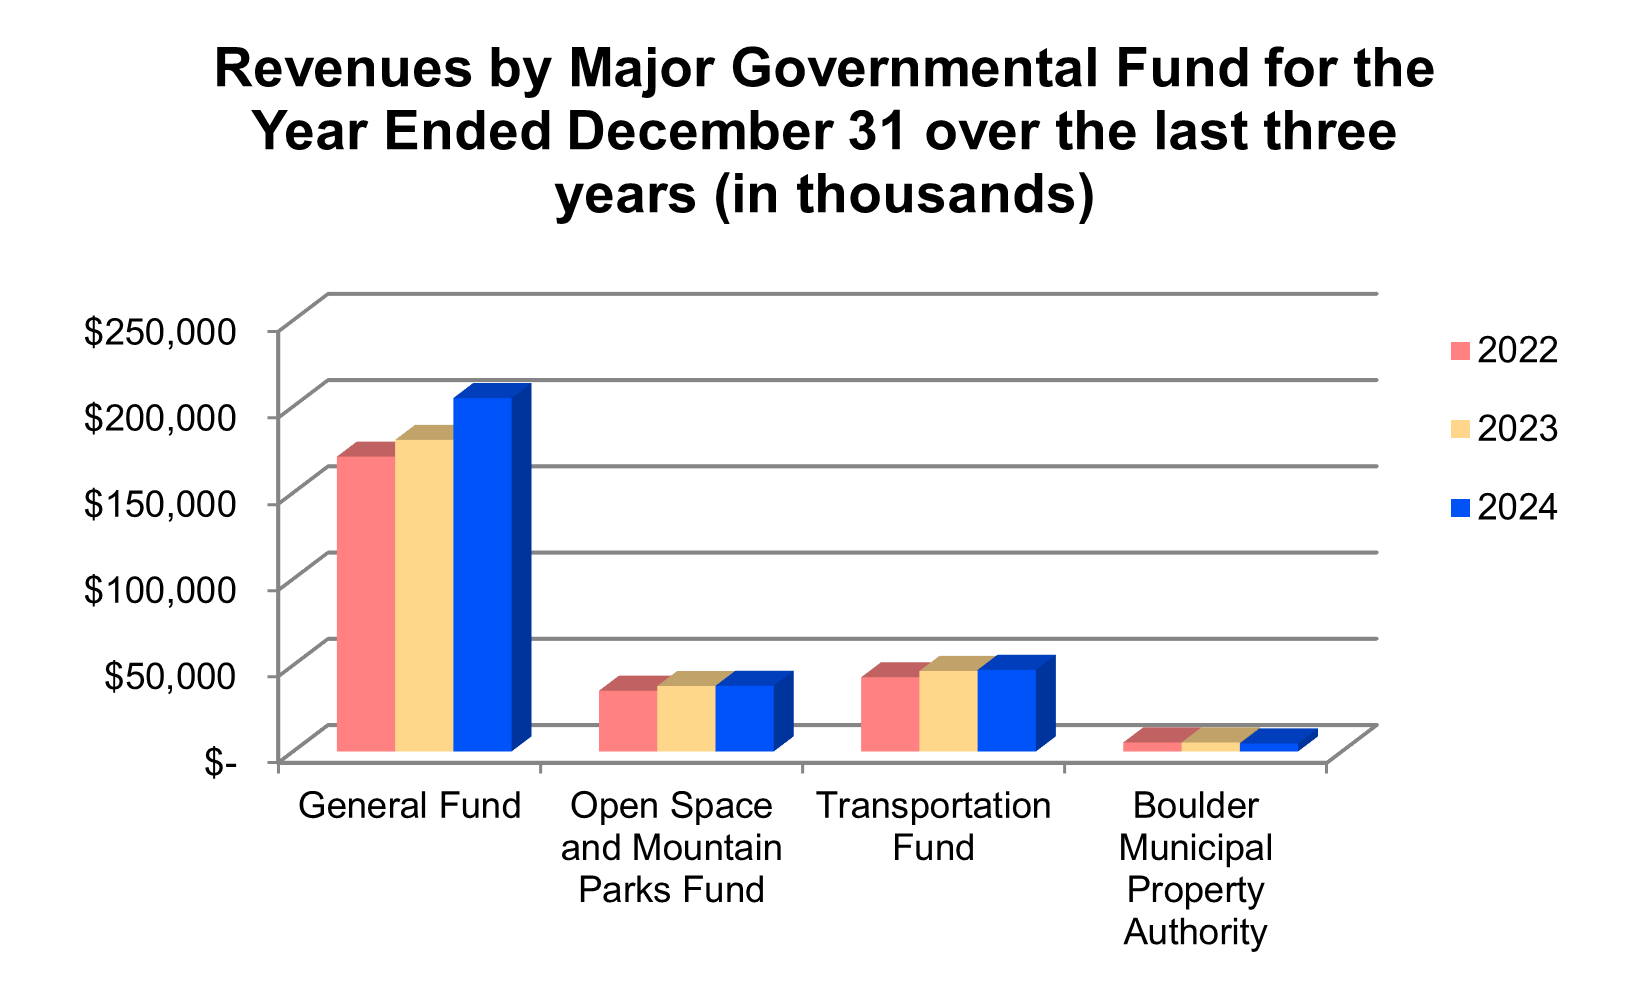
- The General Fund is the primary operating fund of the city. The fund balance of the General Fund was $94.6 million at Dec. 31, 2024, a $2.6 million increase from 2023. The unrestricted fund balance of the General Fund was $93.4 million. This includes the fund balance committed by City Council, the fund balance assigned by city management and any remaining unassigned fund balance. In 2024, General Fund revenues increased $24.3 million. General Fund expenditures increased $7.8 million due to an increase in community grants and budgeted increases to operating expenses.
- The Open Space and Mountain Parks Fund is a major special revenue fund with fund balance restricted for special purposes. The fund balance of the Open Space and Mountain Parks Fund was $27.2 million at Dec. 31, 2024, an increase of $0.5 million from 2023. Revenues rose $0.2 million. Expenditures increased $2.2 million due to increased spending on capital projects.
- The Transportation Fund is another major special revenue fund with fund balance restricted for special purposes. Its fund balance fell $1.0 million to $37.1 million at Dec. 31, 2024, while revenues increased $0.7 million and expenditures increased $11.1 million. Expenditures increased primarily due to the increase in spending on CDOT funded capital projects in 2024.
- The Boulder Municipal Property Authority Fund is a major special revenue fund. This fund’s balance is restricted to certain capital projects by bond covenants. The Boulder Municipal Property Authority’s fund balance rose to $0.5 million in 2024.
2024 Capital Asset Highlights
Governmental Activities
- Acquisition of Land for Future Fire Station #2. $7.9 million
- Completion of North Boulder Library Branch. $4.5 million
- Continued construction of Modular Housing Factory. $6.1 million
- Continued construction of City Western Campus Development. $14.0 million
- Completion of Fire Station #3. $8.9 million
- New vehicle purchases. $13.3 million
Business-type Activities
- Continued construction of Main Sewer Improvements. $38.3 million
- Continued construction for Water Resource Recovery Program Permit Improvements. $16.4 million
- Continued construction of Barker Gravity Pipeline. $5.1 million
- Continued construction of 63rd Water Treatment Facility Electrical Upgrade. $6.0 million
| Capital Assets as of December 31 over the last three years (net of depreciation, in thousands) | 2024 | 2023 | 2022 |
|---|---|---|---|
| Land and Easements | $ 458,883 | $ 447,984 | $ 444,677 |
| Buildings | 191,689 | 106,584 | 111,040 |
| Improvements Other than Buildings | 54,968 | 59,018 | 63,600 |
| Infrastructure | 177,370 | 156,049 | 147,009 |
| Utility Plant in Service and Undergrounds | 466,313 | 463,179 | 453,062 |
| Machinery, Equipment, and Vehicles | 44,414 | 32,339 | 29,047 |
| Construction in Progress | 217,532 | 186,921 | 110,665 |
| Intangibles | 1,250 | 1,350 | 1,450 |
| Software and Licensing | 9,499 | 7,774 | 9,951 |
| Total Capital Assets | $ 1,621,918 | $ 1,461,198 | $ 1,370,501 |
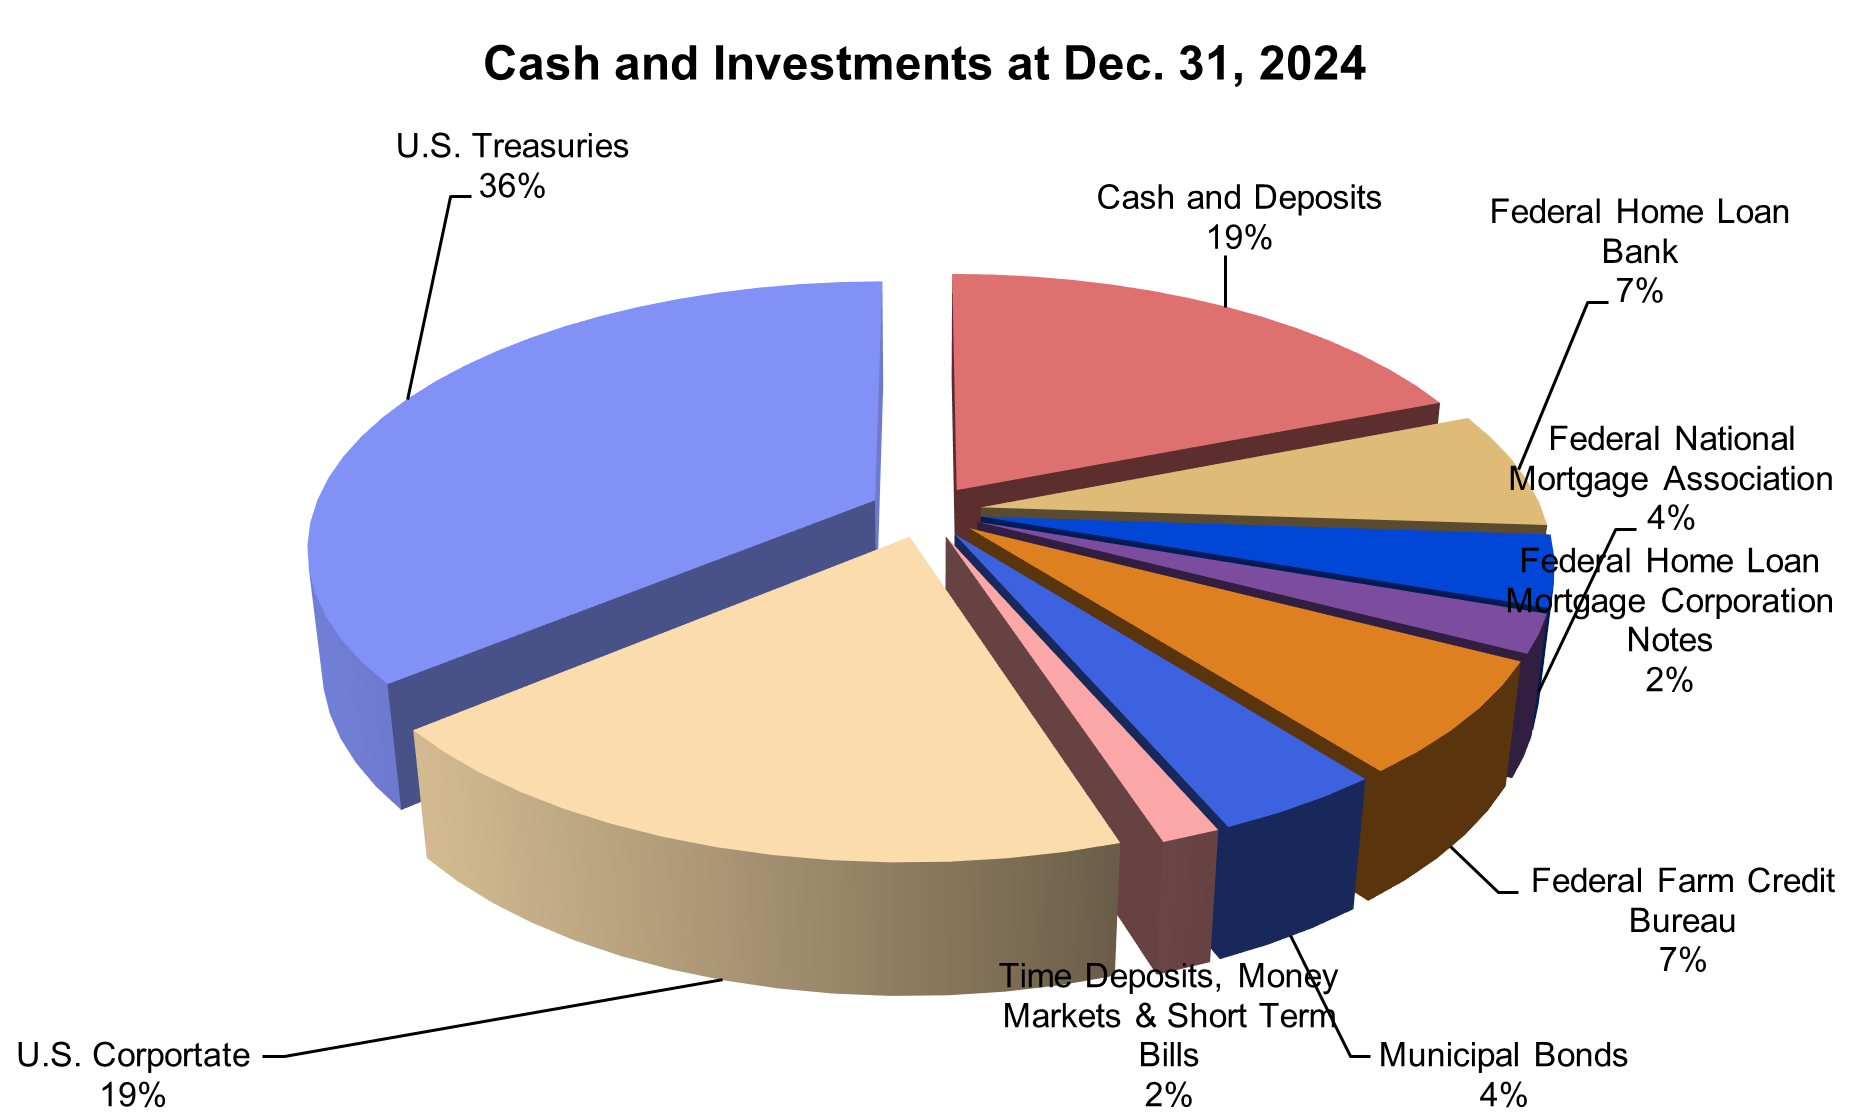
Cash and Investments
The primary objective of the city’s cash and investment strategy is the preservation and protection of investment principal. All investments held in 2024 met city code standards. For detailed investment requirements, see Boulder Revised Code Title 2, Chapter 10.
At Dec. 31, 2024, the fair market value of the city’s cash and investments was $602.6 million. Cash and investments include bond proceeds that are invested separately because of the short-term nature of the bond project funds.
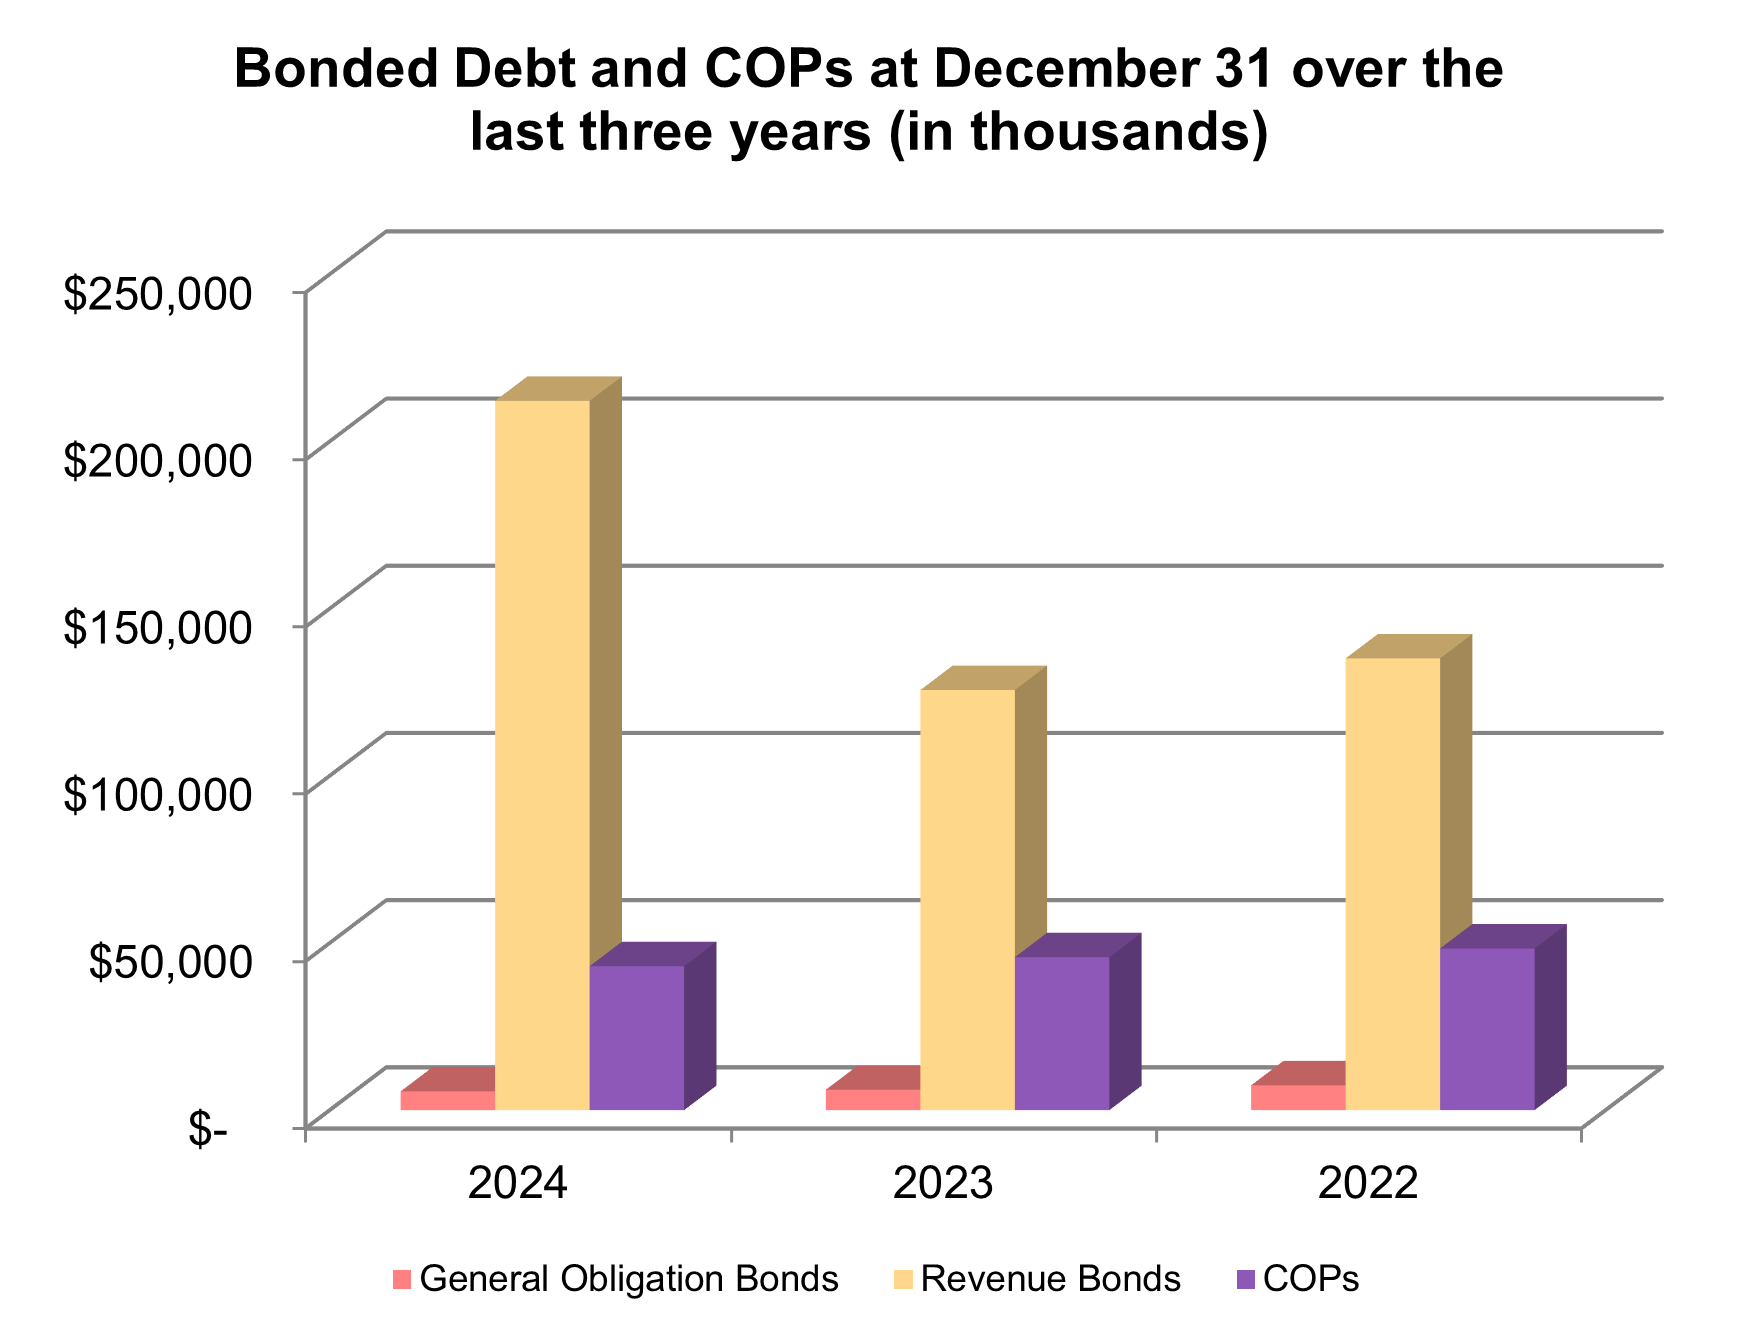
Long Term Liabilities - Debt
The city’s general obligation bond credit rating was AAA by Standard & Poor’s and Aaa by Moody’s Investors Service at Dec. 31, 2024. These highly favorable investment ratings allow the city to pay lower interest rates on its bond issuances.
According to the City Charter, the city’s general obligation debt is subject to a legal limitation of three percent of total assessed real and personal property value. At Dec. 31, 2024, all of the city’s bonded debt was self-supporting, meaning that the ratio of general obligation debt to assessed property value was zero.
At Dec. 31, 2024, the city had total bonded debt of $260.8 million. Of this amount, $5.6 million consisted of general obligation debt backed by the full faith and credit of the city. Another $212.1 million represented bonds secured by specified revenue sources (revenue bonds). Certificates of Participation (COPs) totaled $43.0 million at Dec. 31, 2024. Additional details can be found in Note P of the ACFR’s basic financial statements.
City Government
The City of Boulder is governed by nine City Council members who are elected at-large. The council appoints a full-time city manager to oversee operations (Nuria Rivera-Vandermyde), a city attorney (Teresa Tate) and a municipal judge (Jeffrey Cahn).
If you have questions about this report or need additional financial information, please contact the Finance Department of the City of Boulder by email at accounting@bouldercolorado.gov, by phone at 303-441-1812, or by mail at Finance Department, City of Boulder, P.O. Box 791, Boulder, CO 80306.
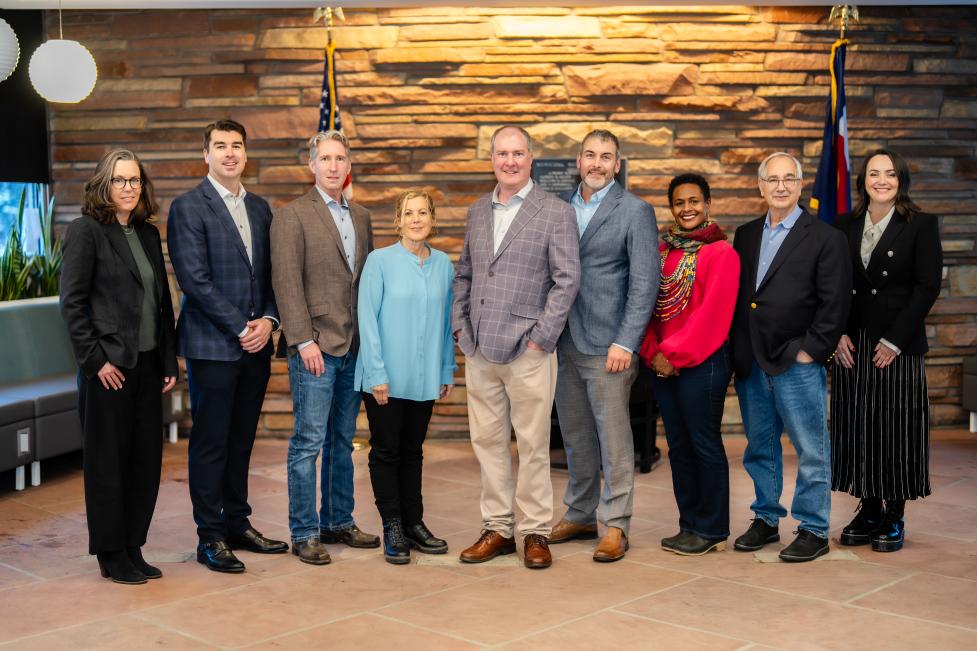
City Council: Tina Marquis, Matt Benjamin, Rob Kaplan, Tara Winer (Mayor Pro Tem), Aaron Brockett (Mayor), Ryan Schuchard, Taishya Adams, Mark Wallach, and Nicole Speer

Nuria Rivera-Vandermyde