Interactive map highlights where to focus transportation safety efforts
Related Events
Interactive map highlights where to focus transportation safety efforts
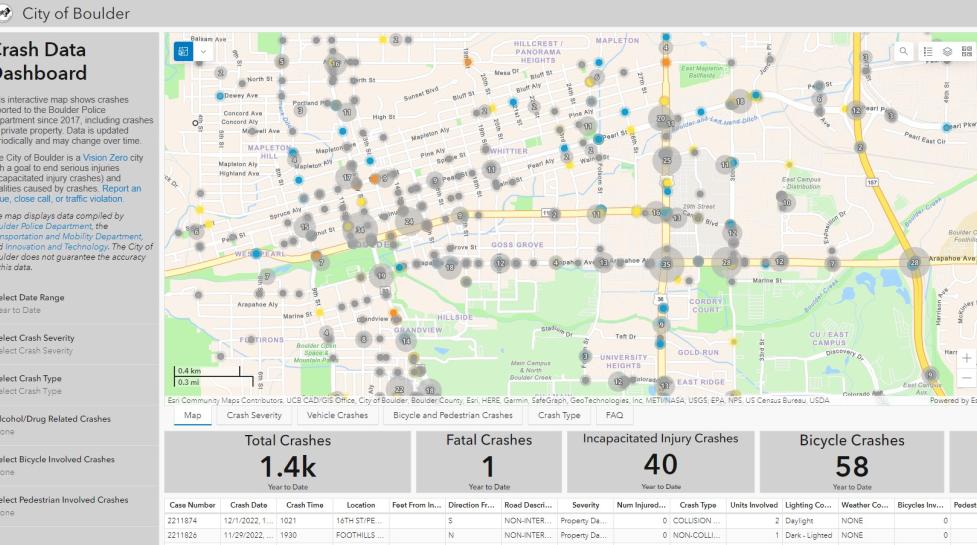
The City of Boulder invites the community to interact with a new crash dashboard created to build awareness of where traffic crashes are happening and increase data transparency. The dashboard includes filters for crash severity, bicycle and pedestrian crashes, alcohol/drug-related crashes, crash type and more.
The tool provides the community a clear view of the most frequent traffic crash locations in the city. The majority (67%) of severe crashes happen on high-traffic arterial streets, which directly informs the prioritization of transportation projects, including safety and connectivity improvements on the city’s Core Arterial Network.
Individual crash point data are available with detailed information. Data are periodically updated and informed by crashes reported to the Boulder Police Department since 2017.
“The data tells us that the top causes of crashes in the city are speeding and left-hand turns, especially in our high-traffic areas,” Boulder Police Chief Maris Herold said.
“This dashboard will further help the community understand our most challenging locations, why they’re a problem, and how we can all work together to better share the road.”
Learn more
The City of Boulder is a Vision Zero city with a goal to eliminate traffic fatalities and serious injuries, with data transparency being part of the goal. The city follows a proactive, data-driven strategy to prevent traffic crashes through community awareness, street design, enforcement and safety education. In 2023, the Vision Zero Action Plan update will be finalized to help identify and prioritize the city’s transportation safety improvements over the next five years.
View the crash dashboard.