Overview

The OSMP Human Dimensions team conducted an onsite intercept survey at select trailheads and access points to engage with open space visitors and obtain their opinions and preferences regarding the potential to allow e-bikes on some trails. A total of 431 visitors completed the survey during a 9-week period in summer 2022 at 12 OSMP locations during various daylight hours. The results are presented here (below) in an interactive report that allows results to be explored dynamically.  

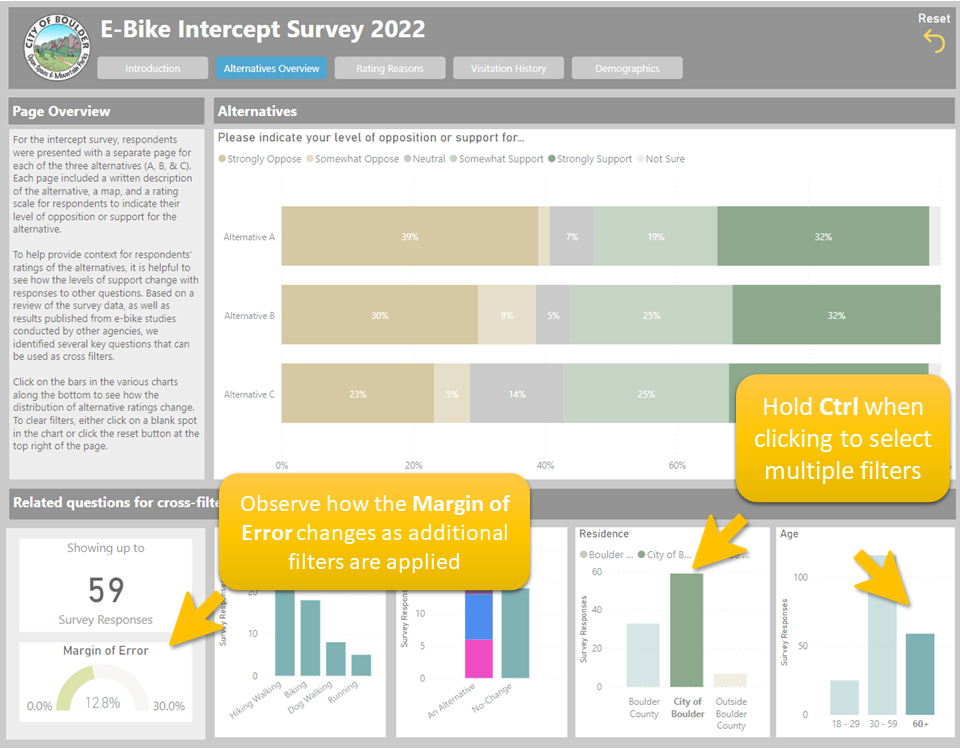
For the onsite intercept survey, respondents were presented with a separate page for each of the three alternatives (A, B, & C). Each page included a written description of the alternative, a map, and a rating scale for respondents to indicate their level of opposition or support for the alternative. Respondents were also provided an option for the status quo (no e-biking on OSMP).

After survey respondents evaluated each of the individual alternatives, they were asked a series of questions about their general disposition across the three alternatives. Questions asked respondents to evaluate the likelihood that allowing e-bikes on open space trails would result in either positive or negative outcomes, the degree to which they were concerned about certain possible impacts, and the degree to which they agreed or disagreed with several statements about e-bike use on open space. Respondents were then asked to select their overall most preferred option, which included each alternative plus an option for the status quo (i.e. No-Change). 

Next, respondents were asked a series of questions about their visitation patterns including their visitation history, their primary activity, and their primary mode of arrival to OSMP. Additionally, respondents were asked if their visitation patterns might change if e-bikes are allowed on select OSMP multi-use trails, that currently allow bikes. If the respondent answered yes, they were then asked how they thought their visitation frequency might change, as well as whether they would be likely to ride an e-bike on trails if allowed.  

Finally, respondents were asked a series of typical demographic questions. Results can be compared to other OSMP survey efforts, to discern any demographic differences and similarities between the onsite intercept e-bike survey and other visitor survey respondents. More broadly, results can be compared with Boulder County census data. 

For more information about the current e-bike evaluation process, please visit the home page for the OSMP Evaluation of E-Bikes on Trails. Results from the intercept survey are available as a digital interactive report further down on this page.

Key Findings

  • Most respondents (63%) selected one of the alternatives over the status quo (No-Change) as their overall “most preferred option”. 

  • Many respondents supported all three Alternatives, even if they preferred one specific alternative.

    • For example, almost all respondents who overall preferred Alternative A (26%) also indicated support for Alternatives B and C when rating them on their individual alternative pages.

  • Approximately 52% of respondents indicated hiking as their primary activity and 19% indicated biking as their primary activity. 

  • Respondents across all alternatives expressed a range of opinions about the likelihood of different outcomes or concerns about the potential impacts of e-bikes. 

    • In general, concerns were lower among those who preferred Alternative A (most permissive for allowing e-bikes) and highest among those who preferred No-Change. 

    • The same pattern was generally observed for the likelihood of outcomes, where those who preferred Alternative A indicated that, on average, they believed the likelihood of positive outcomes was higher and the likelihood of negative outcomes was lower. This pattern reversed for those respondents who preferred No-Change. 

  • Around 28% of respondents, or just over one quarter, thought that they might change their visitation behaviors if e-bikes were allowed on trails. 

    • Of the 28% who thought their visitation behaviors might change, most thought they would visit trails that allow e-bikes less often if e-bikes were allowed.  

  • Most respondents (70%) think e-bikes would support access for different abilities and for an aging population. Most respondents (68%) are also moderately or extremely concerned about rider travel speed.

  • Over half of respondents (54%) said they are not at all likely to ride an e-bike.

  • The majority of respondents were from Boulder County, with just over 50% of all respondents from the City of Boulder. 

Using the Digital Report

The PowerBI platform supports interactive filtering of visuals on a page by selecting different categories using one or more of the other visuals on the page. For the Alternatives Overview and Rating Reasons pages, Primary Activity, Preferred Option, Residence, and Age charts have been added as available options for interactively filtering results.

To filter the results to a specific subset, click on the bar or axis label to select that category. To Select multiple categories from either a single chart or multiple charts, select the first category/filter you want to apply and then hold Ctrl when clicking to select additional filters.

When selecting multiple filters, it is important to keep track of the number of survey responses and the associated Margin of Error. There are many filters available on the Alternatives Overview page and it is easy to subset the data to a point where the sample size will be too small to generate reliable statistics/results. As an additional cue, a warning message will pop up at the top of the screen when the sample size for one or more charts drops below 30.

In general, we recommend applying no more than two filters at a time to maintain a sufficient sample size to minimize the Margin of Error. To clear filters, you can either click the Reset button at the top right hand corner of the page or you can simply click in a blank spot in any of the charts on the page.

The image below shows an example of how to filter the data on the Alternatives Overview page to show responses from City of Boulder residents who are 60+ years of age.

Image
Instructions for e-bike intercept survey dashboard

E-Bike Intercept Survey 2022