View the Fact Sheet

Safety on Iris Avenue
Vision Zero is the Boulder community’s goal to reduce the number of traffic-related fatalities and serious injuries to zero. As part of this effort, the city has created the Vision Zero Action Plan to identify specific actions and strategies to reduce the most common crash types. The Vision Zero Action Plan guides city staff to pursue proactive projects on the Core Arterial Network (CAN) based on the Safe Streets report finding that 67% of severe crashes occur on arterial streets despite them making up only 17% of Boulder’s streets.
People walking and biking are among the most vulnerable users of Boulder’s transportation network and are overrepresented in Boulder’s severe crashes.
Although pedestrians were involved in only 2% of all crashes citywide (about 46 per year) from 2018 to 2020, they were involved in 18% of all severe crashes (about nine per year) in that timeframe.
Although bicyclists were involved in only 6% of all crashes citywide (about 118 per year) from 2018 to 2020, they were involved in 36% of all severe crashes (about 18 per year).
Crash data along the Iris Avenue Transportation Improvements Project corridor
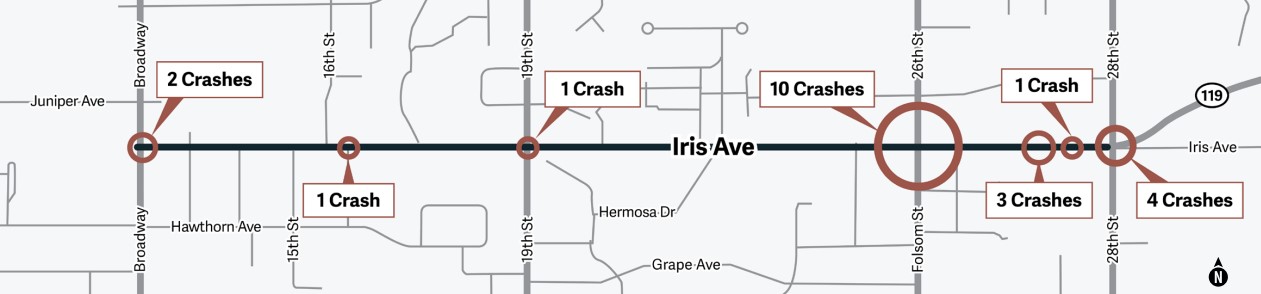
Pedestrian and Bicycle Crash Data on Iris Avenue
There were 22 pedestrian and bicycle crashes from 2016-2023 along the Iris Avenue corridor.
45% of those pedestrian and bicycle crashes happened near the 26th Street and Folsom Street intersection.
- There have been a total of 345 crashes, or roughly 43 per year from 2016 through 2023, six resulting in serious injury.
- 143 of those were rear-end crashes.
- 58 of those were approach turn crashes, turning across oncoming traffic.
- Iris Avenue from 19th Street to 28th Street is on the 2023-2027 Vision Zero Action Plan High Risk Network.
Vehicle speeds along the project corridor
Iris Avenue Corridor Speeding Data
Data shows most drivers are speeding on Iris Avenue between Broadway and 26th Street. Speeding leads to numerous safety concerns and increases the severity of crashes involving vehicles (FHWA).
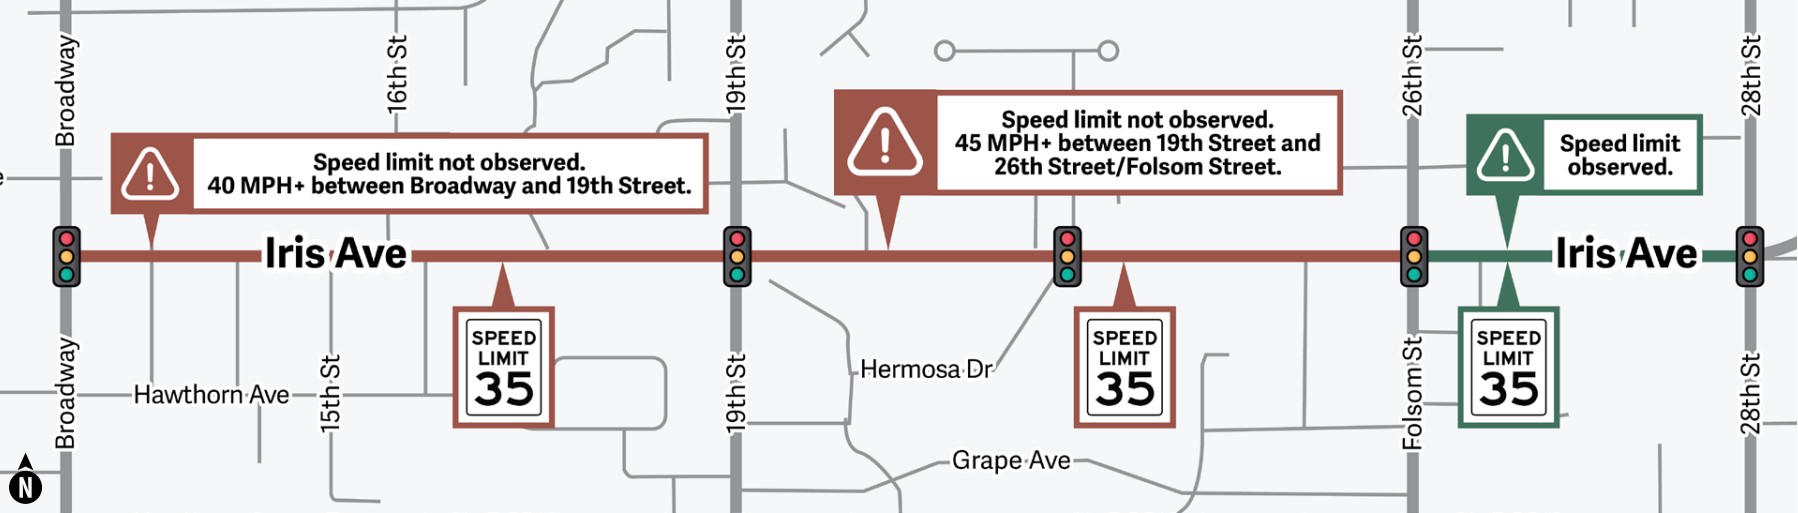
Iris Avenue Corridor Vehicular Travel Speed Data
| Location | East of 16th Street | East of 19th Street | East of 26th Street/ Folsom Street | |||
|---|---|---|---|---|---|---|
| Direction | Eastbound | Westbound | Eastbound | Westbound | Eastbound | Westbound |
| Median Speed | 36.8 mph | 36.3 mph | 37.1 mph | 35.3 mph | 32.7 mph | 32.4 mph |
| Prevailing Speed (85% of speeds at or below) | 41.0 mph | 40.8 mph | 42.1 mph | 40.0 mph | 37.3 mph | 37.0 mph |
| Top-End Speeders (% over 45 mph) | 3.8% | 3.3% | 5.7% | 2.6% | 0.8% | 0.8% |

Public Feedback
About a quarter of all project comments remark on high vehicle speeds, associated noise, and feeling of discomfort or lack of safety if walking/ biking.
"I walk my daughter to school and cross Iris every day in the morning and afternoon. Cars drive way too fast so I don’t know if I’ll ever let her walk to school alone.”
- "Anna," North Boulder Resident, mother of two school-aged children, walks to school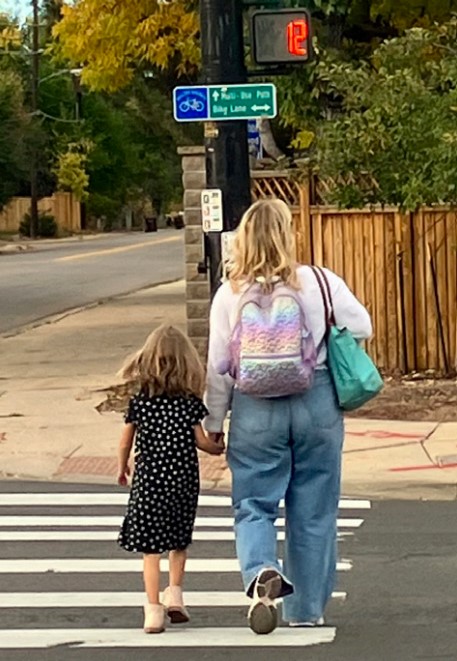
How to moderate speeding along the project corridor
What Can Moderating Vehicle Speeds Do?
It can significantly reduce the potential for injuries resulting from crashes
It can improve yielding compliance at crossings.
It can reduce noise from acceleration and braking of vehicles.
It can make biking, walking, transit, and crossing conditions more comfortable.
Bike Lane Design Facts
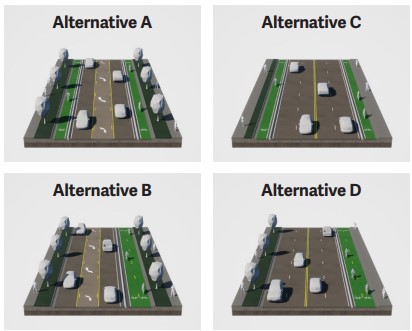
The current bike lane condition of Iris Avenue contributes to speeding due to the lack of vertical elements.
Protected bike lanes in all four conceptual alternatives have the potential to reduce speeding, and thereby, crash severity (FHWA).
"Narrower streets help promote slower driving speeds which, in turn, reduce the severity of crashes.”
- National Association of City Transportation OfficialsRoadway Design Facts
Wider roadways encourage speeding (Johns Hopkins Bloomberg School of Public Health, NACTO).
Alternatives A and B have a higher potential to reduce speeds and crashes for drivers due to lane configuration and additional protected intersection elements (FHWA).
Alternatives C and D may also provide some speed moderation due to vertical separation between the protected bike lane and the vehicle travel lane.
The Road to Zero Crashes
Iris Avenue has five of the six risk factors that account for the most frequent and severe crashes.
- Vision Zero Action PlanThese Factors Place Iris Avenue From 19th to 28th Street on the High Risk Network.
Daily vehicle traffic between 5,000 and 10,000 per travel lane.
Signalized intersections.
Major unsignalized intersection.
Businesses and a mix of land uses present.
85% of vehicle speeds at or above 30 mph.
Preventing and Reducing Severity of Crashes Along the Iris Avenue Project Corridor
Projects like the Iris Avenue Transportation Improvements Project implement proactive safety measures before our community experiences a tragedy, a shift from the traditional paradigm that waits until a tragedy occurs to make improvements.
The Main Crash Types on Iris Avenue Are Rear End and Turn-Related

Three Vehicle Lane Road Configurations Can Reduce the Number of Conflict Points and the Severity of Crashes When They Do Occur
The number of typical crash types are reduced by 50% when a road reconfiguration, from four lanes to three, is introduced.

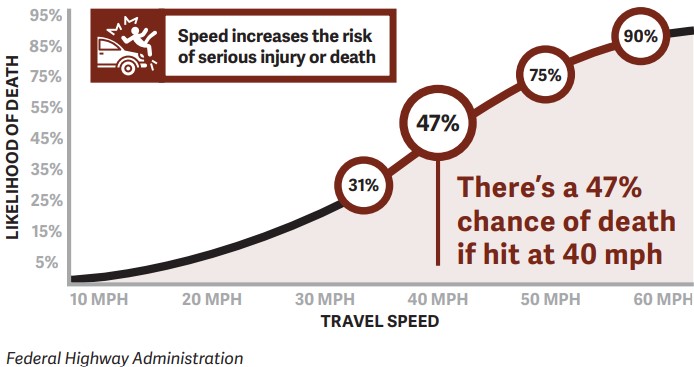
Risk of Death Based on Impact Speed
Pedestrians struck by a forward-moving car.
Roadway Reconfiguration and Bike Lanes Are Federal Highway Administration Proven Safety Countermeasures
What Is a Proven Safety Countermeasure (PSC)?
"Countermeasures and strategies effective in reducing roadway fatalities and serious injuries on our Nation’s highways. Transportation agencies are strongly encouraged to consider widespread implementation of PSCs to accelerate the achievement of local, State, and National safety goals. These strategies are designed for all road users and all kinds of roads—from rural to urban, from high-volume freeways to less traveled two-lane State and county roads, from signalized crossings to horizontal curves, and everything in between.”
- U.S. Department of Transportation Federal Highway AdministrationFHWA guidance on road reconfigurations and safety benefits
Iris Avenue Has an Average Daily Traffic Less Than 25,000
Roadway reconfigurations are feasible and are included as alternatives due to their ability to reduce conflict points and vehicle speeds, both of which reduce the frequency and severity of crashes.
"A roadway reconfiguration can improve safety, calm traffic, provide better mobility and access for all road users, and enhance overall quality of life. A roadway reconfiguration typically involves converting an existing four-lane undivided roadway to a three-lane roadway consisting of two through lanes and a center two-way left-turn lane (TWLTL)"
- U.S. Department of Transportation Federal Highway AdministrationBenefits Include:
Reduction of rear-end and left-turn crashes due to the dedicated left-turn lane.
Reduced right-angle crashes as side street motorists cross three versus four travel lanes.
Fewer lanes for pedestrians to cross.
Opportunity to install pedestrian refuge islands, bicycle lanes, or transit stops.
Lane configurations that encourage speed limit compliance.

A more community-focused, Complete Streets environment that better accommodates the needs of all road users.
"A road reconfiguration is a lower-cost safety solution, when compared to a complete roadway rebuild, especially when planned in conjunction with a pavement overlay. Typically, a road reconfiguration is implemented on a roadway with an average daily traffic of 25,000 or less."
- U.S. Department of Transportation Federal Highway AdministrationThis is a text alternative to the chart. The chart displays the likelihood of death by impact speed for pedestrians struck by a forward-moving car. Speed increases the risk of serious injury or death. There is a 47% chance of death at 40 mph and a 90% chance of serious injury or death at 60 mph.