This is an alternative web-accessible version to the original Boulder Speed Limit Setting Framework PDF.
Holiday Closures
In observance of the winter holidays, the City of Boulder is adjusting its operations schedules.
This is an alternative web-accessible version to the original Boulder Speed Limit Setting Framework PDF.
The City of Boulder’s Transportation and Mobility Department has undertaken this project to develop a data-driven and context-sensitive process to set speed limits on city-owned streets. The project establishes a consistent framework for setting and communicating speed limits citywide with the aim to reduce speed-related crashes as part of Vision Zero, Boulder’s goal to end severe crashes. The 2022 Vision Zero Boulder: Safe Streets Report identified speeding as an over-represented factor, associated with nearly one-third of serious injury and fatal crashes in the 3-year time period (2018-2020). Public feedback for the 2023 Vison Zero Action Plan listed speeding as one of the Top 4 traffic safety concerns, and high-speed streets are identified as one of the Top 6 risk factors associated with the city’s High Risk Network. Action 7 was identified in the Plan to “Update and implement Boulder’s policies and practices regarding speed limit setting to better align target and actual operating speeds”. This project is one of many components the City of Boulder is exploring to reduce speeding-related crashes and improve safety for all roadway users.
The prevailing speed limit setting and signing practices in Boulder have led to inconsistent outcomes lacking quantifiable justification. The historic practice was reactive to community concerns. The goal of these guidelines is to improve consistency and develop a standard methodology behind speed limit setting and signing by establishing a data-driven citywide approach and practice. The purpose of this report is to create a transparent document to share this methodology with the community and stakeholders.
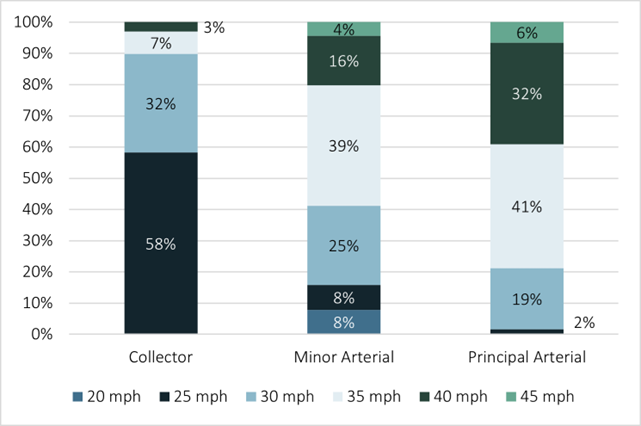
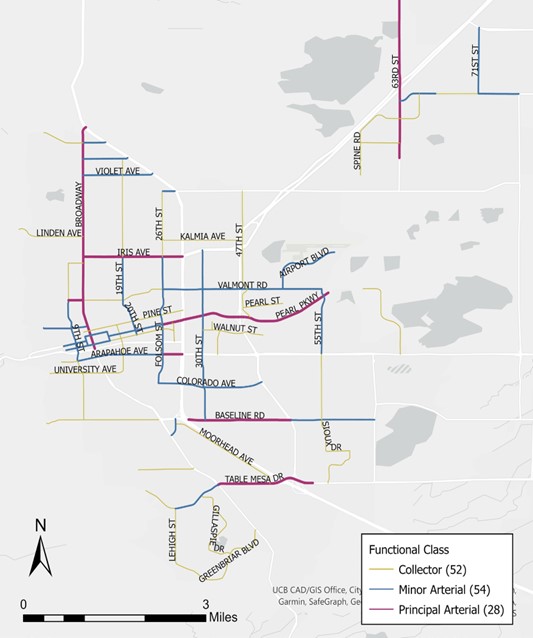
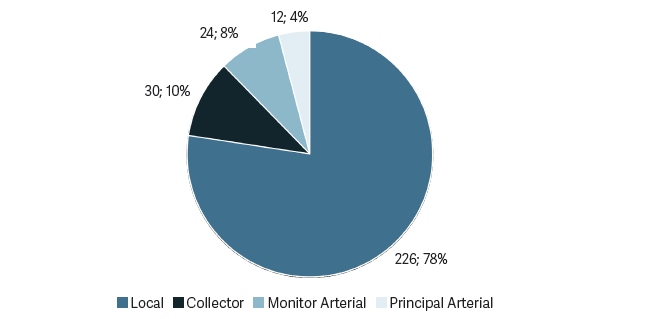
There are approximately 292 miles of city-owned streets within Boulder that are classified as local, collector, minor arterial and principal arterial (Figure 1). A vast majority, 78% of these streets are classified as local streets (Figure 2). The 20 IS PLENTY initiative established a standard 20 mph speed limit on these streets whether or not there is a posted speed limit sign or not. As such, this project aims to establish a process to set speed limits with a focus on collector and arterial roadways. Of the remaining 66 miles of collectors and arterials, the vast majority are posted at 35 mph or less (Figure 3). Of collectors, almost 58% are posted at 25 mph. Minor arterial and principal arterial streets generally have higher posted speed limits compared to collectors.
Land-use plays a vital role in determining roadway characteristics, which in turn impacts the speed limit of the street. This project analyzed existing zoning classifications within the Boulder Municipal Code to categorize the zoning into four land uses: downtown, residential/mixed-use/public, business and industrial/agricultural (Figure 4). The speed limit setting methodology takes into consideration these existing land-uses on either side of the street.
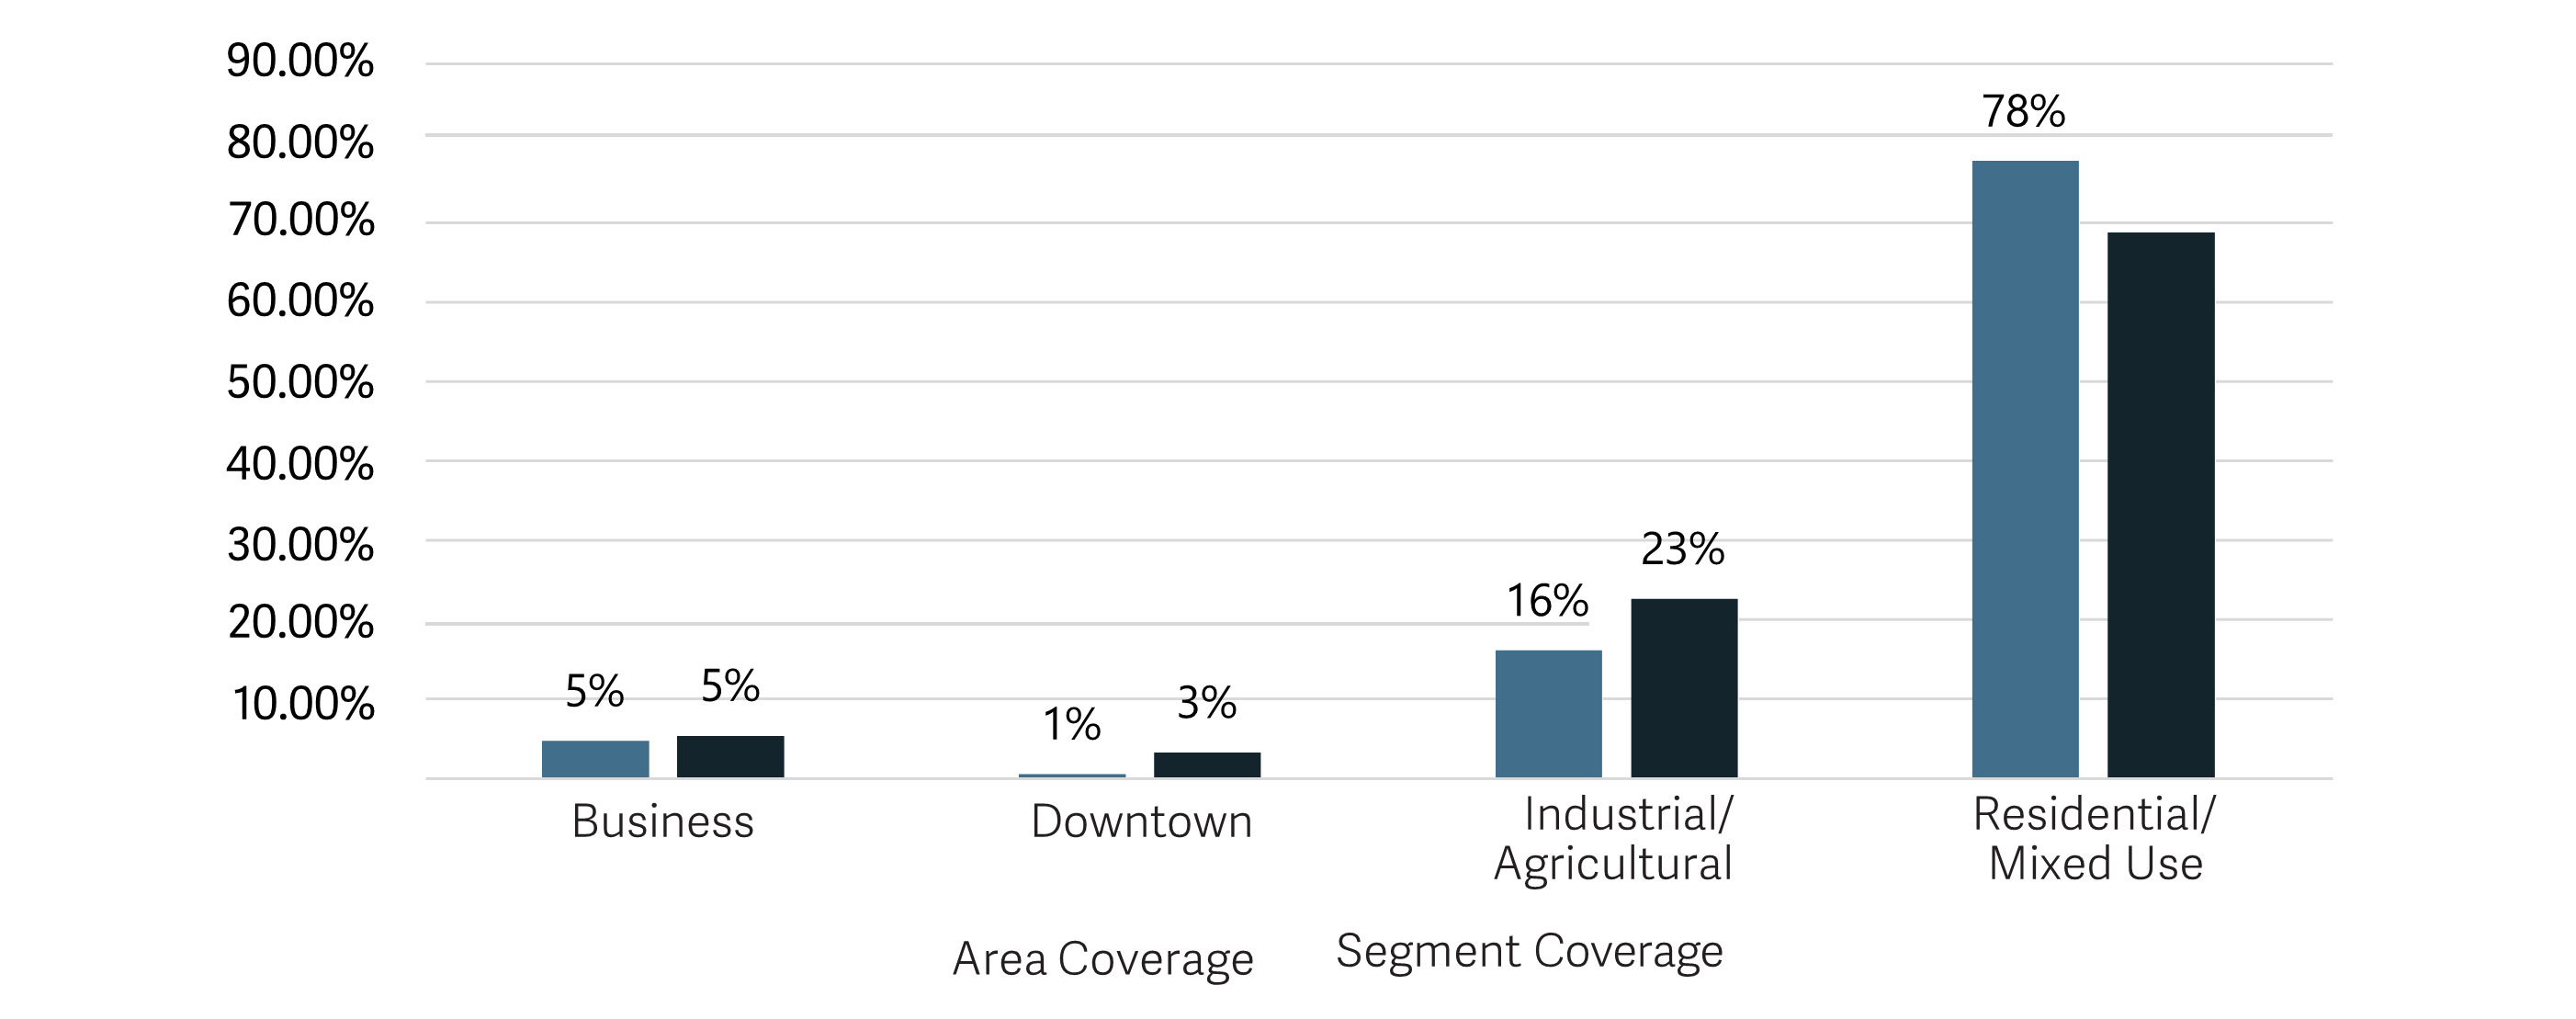
Residential/mixed use land-use covers approximately 78% of Boulder’s land area, which corresponds with approximately 69% of street segments analyzed in the project (Figure 5). Industrial/agricultural, downtown and business land-use coverage generally aligns with the mileage of the street segments analyzed in the project, as shown in the figure below.
The existing posted speed limit range for any particular functional classification of roadway varies significantly across the land-uses (Table 1). For example, a collector in residential/mixed use area currently has a posted speed limit as high as 40 mph, while a collector in an industrial/agricultural land use has a maximum posted speed limit of 35 mph. Similarly, a principal arterial in downtown has a 30 mph speed limit, while it is as low as 25 mph in the residential / mixed-use area. These examples illustrate the inconsistency of existing posted speed limits in Boulder.
Existing Conditions | Zoning Classifications per 9-5-2.a of Boulder Municipal Code | |||
---|---|---|---|---|
Downtown | Residential / Mixed Use / Public | Business | Industrial Agricultural | |
Collector Speed Limit | 25-25 | 25-40 | 25-25 | 25-35 |
Minor Arterial Speed Limit | 20-25 | 20-40 | 30-35 | 30-45 |
Principal Arterial Speed Limit | 30-30 | 25-40 | 30-35 | 35-45 |
The following stakeholders were involved throughout the project. They provided guidance for the project, offering their lived experiences of Boulder’s transportation system and community perspective to inform the project process in alignment with the overall goals of the project.
Three stakeholder meetings were conducted during the course of the project. The following section provides a summary of the meetings and resulting outcomes.
The purpose of the meeting was to introduce the project goals to the stakeholders, discuss anticipated outcomes, and identify key issues to be addressed by the project. The introduction of the project background, purpose and goals resulted in several discussion points with the stakeholders that led to the following clarifying points:
The purpose of this meeting was to educate stakeholders on the national best practices, summarize peer agency approaches to speed limit setting and brainstorm factors to include in the methodology for Boulder. The summary of the outcomes were:
The purpose of this meeting was to review the draft methodology for setting speed limits in Boulder, along with a few of the preliminary recommended speed limits. The examples of speed limit changes recommended by the methodology on particular streets helped the stakeholders understand the process. The stakeholders were generally, supportive of the overall methodology. Stakeholders raised questions about how often the street segments will be re-evaluated in the future, and the need for further refinement of the methodology. The project team communicated that Boulder is anticipated to re-evaluate the street segments when there is significant change in the roadway characteristics, such as when a capital improvement project or new development is completed, and noted that Boulder staff has reviewed the methodology in detail and plan to further refine it, if necessary, in the future.
Seven documents were reviewed by the project team to understand nationally recognized best practices: the Manual of Uniform Traffic Control Devices (MUTCD) from 2009 and 2023; the Institute of Transportation Engineers (ITE) Speed Management for Safety Tools; FHWA’s Noteworthy Speed Management Practices; the National Association of City Transportation Officials (NACTO) City Limits Document; FHWA’s USLimits2; and the National Cooperative Highway Research Program Posted Speed Limit Setting Procedure Tool.
The key takeaway from this review is that the transportation profession has broadened the range of operating speeds that can be used to determine posted speed limits from the 85th-percentile, as stated in the 2009 MUTCD, to 50th-percentile and 85th-percentile speed, as stated in the 2023 MUTCD. This change allows jurisdictions the flexibility to reduce posted speeds to the median speed of vehicles traveling on the roadway. Furthermore, the review confirms the roadway contextual factors to consider when setting speed limits. These factors were reviewed and considered to determine the recommended factors that were incorporated into the city’s methodology.
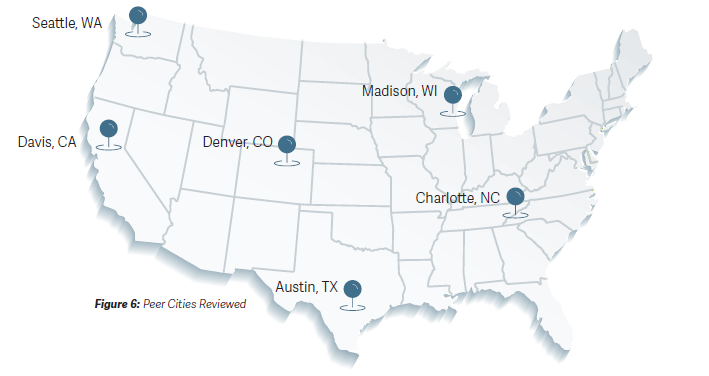
Six cities, shown on the map in Figure 6, were interviewed to better understand how they set their speed limits. The cities were Austin, TX; Charlotte, NC; Madison, WI; Seattle, WA; Davis, CA; and Denver, CO. Key takeaways from the peer cities review highlight the significant role of the local authority and engineering judgment in determining speed limit regulations. The approach to speed management varied, ranging from corridor-specific adjustments to city-wide initiatives, albeit often influenced by resource constraints. Methodologies employed encompass a spectrum from engineering judgment to national tools, or the creation of customized approaches. In response, this project aims to craft a tailored methodology, drawing from national tools and best practices. In addition to peer cities, Colorado Department of Transportation (CDOT) guidelines were evaluated. CDOT is currently working on its own speed limit setting methodology, which will be used to set speeds on state highways across the state. While Boulder doesn’t have authority to set speed limits on state highways, reviewing CDOT’s methodology provided the framework for the Boulder’s methodology and the opportunity to build on it. The CDOT process uses a Lookup Table based on roadway classification and land use, which is also used in the Boulder methodology with local context-sensitive information.
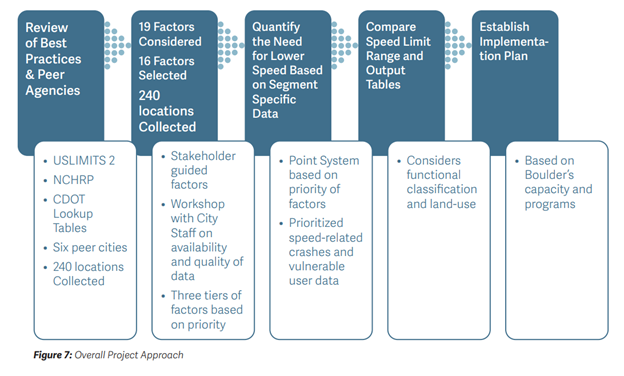
City of Boulder’s pioneering approach to citywide speed limit setting considered the national best practices and peer agency reviews discussed above, along with input from the stakeholder committee to identify the factors that should be considered in a speed limit setting analysis and an innovative point-based system that prioritized the factors and assigned them to the segments based on segment-specific data. Figure 7 shows the overall project approach used in the project.
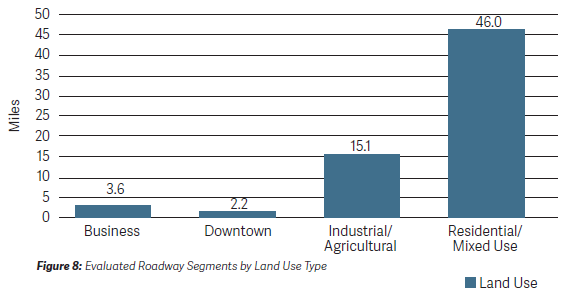
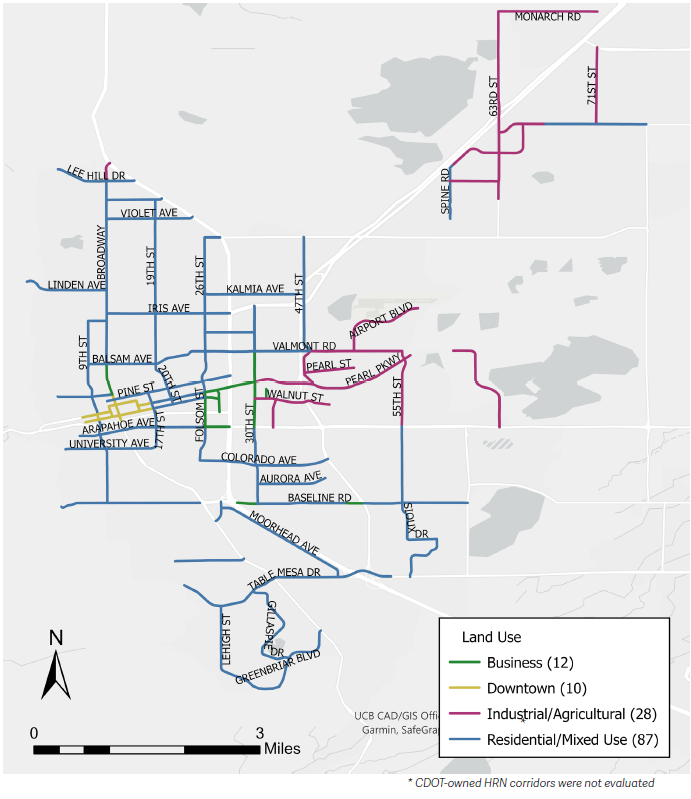
This proposed methodology applies to collector, minor arterial, and principal arterial roads owned by the City. This method does not apply to local roads , school zones or CDOT state highways. The roads to be evaluated were segmented by existing posted speed and street classification. The average length of evaluated segments is half a mile. Approximately 67 miles of roads were evaluated, divided into 137 segments. In these cases, the average measured speed was used for the methodology. As shown in Figure 8, a vast majority of the segments were in residential / mixed-use land use. Figure 9 shows street segments that were evaluated as part of the project.
Operating Speed: actual vehicular speed collected in the field. It is often presented as a percentile. It is impacted by the posted speed limit, along with the design of the roadway, enforcement, etc.
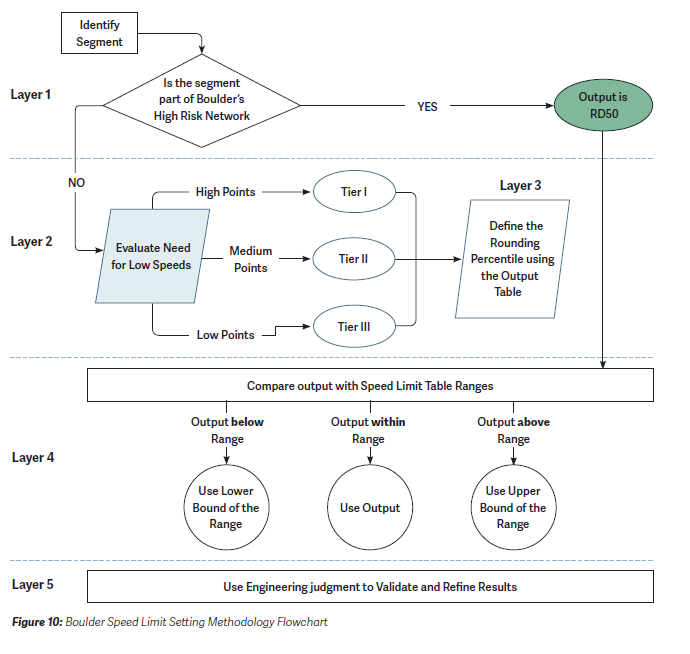
City of Boulder’s approach to citywide speed limit setting introduces a five-layer evaluation process tailored to local parameters (Figure 10). It introduces a point-based system that aligns with Boulder Vision Zero values that utilizes local data.
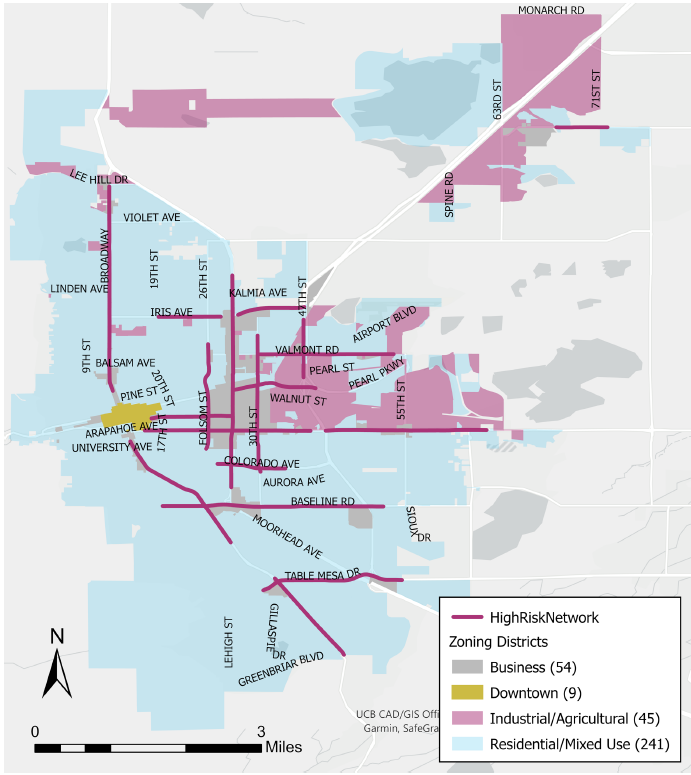
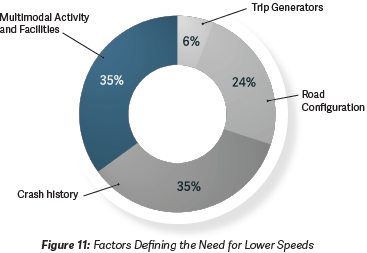
The first layer of evaluation is identifying if the segment is part of the existing High-Risk Network (HRN). The HRN, developed as part of the 2023-2027 Vision Zero Action Plan, represents just 7% of city streets but accounts for 48% of serious- and fatal-injury crashes in the city. Within the methodology, street segments in the HRN are set to default to lower speeds by recommending to the Rounded Down 50th-percentile speed. This priority step aligns with the city’s Vision Zero commitment, streamlines the process by eliminating Subsequent layers of analysis, and aligns with the Safer Speeds aspect of the Safe Systems Approach. The second layer of evaluation is a point system that quantifies the need for lower speeds. Points were awarded to locations based on 16 factors (Table 2): Each factor is given a point, ranging from 1-15, depending on its priority in determining the appropriate posted speed limit. For example, a segment with a crash resulting in a fatality is given 15 points, while presence of a park within ¼ mile of the segment is given 2 points. Thirty-five percent of the available points are allocated to crashrelated factors, thirty-five percent to multimodal use and facility factors, twenty-four percent to road configuration factors, and six percent by the presence of trip generators factors. This step reinforces the data-driven approach of the methodology and defines Boulder-specific thresholds for all 16 factors. The assigned points determine the associated tier for the segment, with Tier I being 55-100 points, Tier 2 being 34-54 points, and Tier 3 being 0-33 points.
Factor | Category | Priority | Maximum Points |
---|---|---|---|
Fatal crashes | Crash | Priority 1 | 15 |
Pedestrian/Bike crashes | Crash | Priority 1 | 10 |
Speed crashes | Priority 1 | 10 | |
Multimodal Crossings | Multimodal | Priority 1 | 5 |
Pedestrian facilities | Multimodal | Priority 1 | 5 |
Pedestrian activity | Multimodal | Priority 1 | 1 |
Bike facilities | Multimodal | Priority 1 | 5 |
Bike activity | Multimodal | Priority 1 | 10 |
Driveway Access Density | Road Configuration | Priority 1 | 5 |
On street parking | Road Configuration | Priority 2 | 5 |
Unsignalized Density | Road Configuration | Priority 2 | 5 |
Signalized intersection density | Road Configuration | Priority 2 | 5 |
Number of Through lanes | Road Configuration | Priority 2 | 4 |
Schools | Trip generators | Priority 3 | 2 |
Park | Trip generators | Priority 3 | 2 |
Assisted living facility | Trip generators | Priority 3 | 2 |
The third layer of the evaluation is an output table (Table 3), where the functional classification, the land use, and the point system evaluation play a role in determining the observed speed percentile that should govern the speed limit setting. The possible outputs of the methodology are closest 85th percentile (C85), roundeddown 85th percentile (RD85), closest 50th percentile (C50), and rounded down 50th percentile (RD50). (E.g. if the 50th percentile speed is 33 mph, then the C50 output would be 35 mph, while the RD50 output would be 30 mph, etc.).
Speed Category | Land Use | ||||||||
---|---|---|---|---|---|---|---|---|---|
Residential/ Mixed Used | Business/ Downtown | Industrial/ Agricultural | |||||||
Tier III | Tier II | Tier I | Tier III | Tier II | Tier I | Tier III | Tier II | Tier I | |
Collector | C50 | RD50 | RD50 | C50 | C50 | RD50 | RD85 | RD85 | C50 |
Minor Arterial | C50 | C50 | RD50 | RD85 | C50 | C50 | C85 | RD85 | RD85 |
Principal Arterial | RD85 | C50 | C50 | C85 | RD85 | RD85 | C85 | C85 | RD85 |
The fourth layer is the Speed Limit Table (Table 4) which establishes ranges of appropriate speeds for each land use and functional classification group. The table is also a policy defining piece of the methodology, where the city is able to define target speeds irrespective of the observed operational speeds of the corridor. Whenever the operating speeds in a segment falls outside the speed range shown in the Speed Limit Table, the values in the table will dictate the speed limit methodology’s recommendation for the segment
Functional Classification | Land Use | ||
---|---|---|---|
Downtown | Residential/Mixed Use /Business/Public | Industrial/ Agricultural | |
Local (shown for informational purposes only) | 20 mph | 20 mph | 20 mph |
Collector | 20 - 25 mph | 20 - 30 mph | 25 - 35 mph |
Minor Arterial | 20 - 35 mph | 30 - 40 mph | |
Principal Arterial | 25 - 35 mph | 30 - 45 mph |
The fifth and final layer is to apply engineering judgement to ensure that the final recommendation is context-sensitive, financially and technically feasible, and meets the expectation of the community. City staff will review the corridor, its surrounding areas, and the speed recommended by the methodology to validate and refine the results as needed. Special attention will be given to corridors near the city limits where roads transition from Boulder’s jurisdiction to County roads and consistency on the posted speed limit is expected. Segments with recommended changes greater than 5 miles per hour will be manually reviewed as well. Long corridors will also be checked to ensure consistency on the posted speed limits, ensuring that the posted signs do not unnecessarily change without significant changes on the road context. While city staff understand and respect the methodology used to develop recommended speed limits on evaluated segments, as part of its unwavering commitment to Vision Zero, the city is not planning to raise any posted speed limits at this time. Engineering judgment will be applied to segments with recommended speed limit reductions to ensure consistency, credibility, and enforceability. The proposed Boulder speed limit setting methodology not only incorporates city-specific parameters but also establishes a precedent to determine policies that extend beyond the operating speeds.
VIII. Preliminary Results
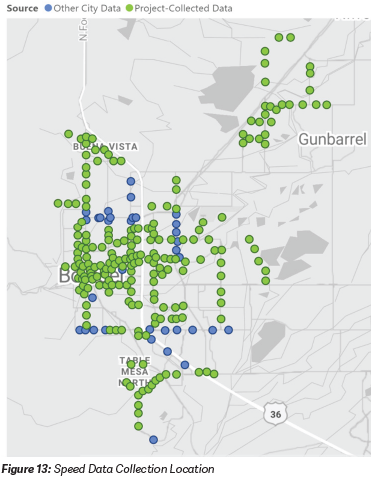
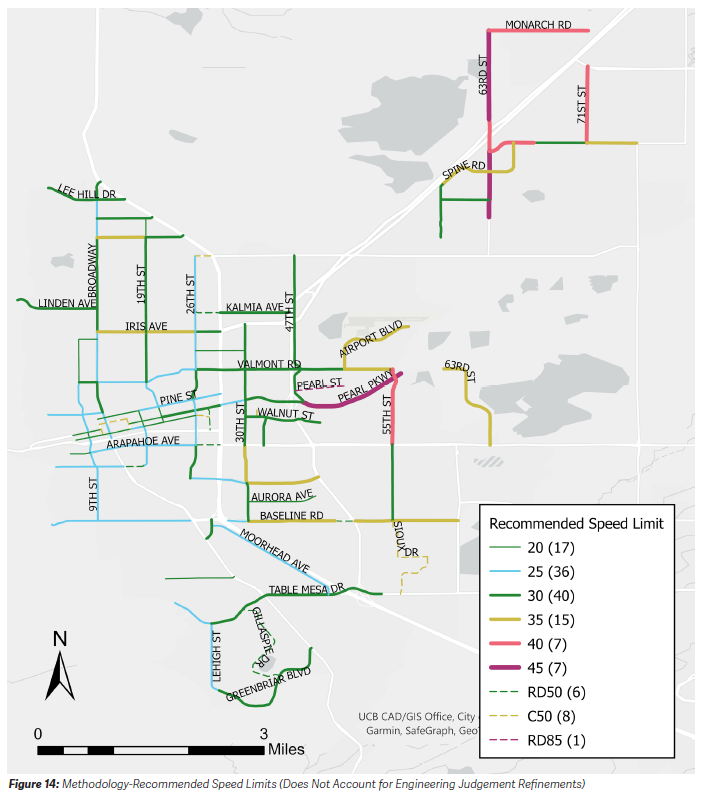
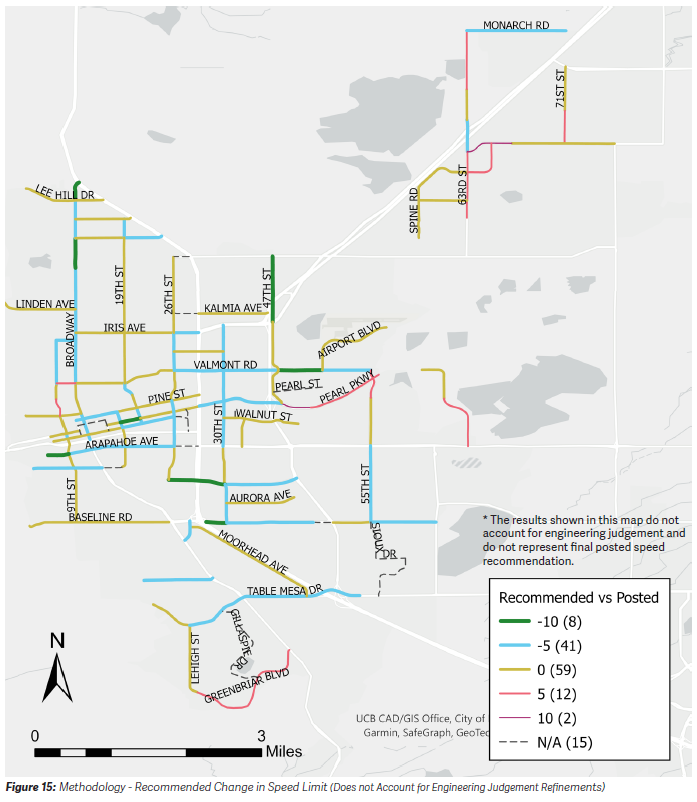
Preliminary results account for the full methodology application on all the evaluated segments. Fifteen of the 137 segments did not have speed data available and for those locations; the methodology suggests the rounding criteria for those segments (i.e., rounded down 50th percentile versus closest 85th percentile). With a focus on a data-driven approach, vehicular speed and volume data was collected at 206 new locations, in three-day (Tuesday through Thursday) periods that varied from October 31 to December 21, 2023, excluding major holidays and weekends, as shown on Figure 13. Additional data previously collected by the city from various other efforts were also included in the evaluation. A total of 240 speed data collection points were incorporated in this study. This represented one of the largest data collection efforts ever undertaken by the city. Figure 14 shows the recommended speed limits after the application of the methodology. Figure 15 shows the methodology-recommended change in speed limit after comparing it with the existing posted speed limit for each of the street segments. Neither Figure 14 nor Figure 15 account for the final layer of engineering judgment. The goal is to showcase how the methodology performs by itself before city staff refinement to demonstrate the robustness of the methodology.
Figure 14 shows the methodology-recommended speed limit, before the engineering judgement refinement. It can be observed that the lower speed limits are found towards the city center and near the downtown area. The highest speed limits are found in industrial/ agricultural areas towards the city’s borders. The speed limit on those higher-speed locations will need to be evaluated and refined to ensure a consistent transition between city and County roads and CDOT state highways.
Table 5 shows the length of the segments (miles) by functional classification and methodology-recommended speed limit. The methodology indicated that the recommended speed limit should be 40 mph on 4 miles, and 45 mph on 3.2 miles of approximately 67 miles of evaluated roadway. There were 5.5 miles of segments that did not have available speed data. These are shown in the RD50, C50, and RD85 columns of Table 5. Once data is collected on those segments, the rounding criteria can easily be applied
Speed Category: | Recommended Speed Limit (mph) or Rounding Criteria | Total Length (mi.) | ||||||||
---|---|---|---|---|---|---|---|---|---|---|
20 | 25 | 30 | 25 | 40 | 45 | RD50 | C50 | RD85 | ||
Total Length (mi.) | ||||||||||
Collector | 3.1 | 9.6 | 10.8 | 2.5 | 2.1 | 1.7 | 0.5 | 30.4 | ||
Minor Arterial | 1.5 | 4.6 | 7.7 | 4.8 | 3.5 | 0.7 | 22.9 | |||
Principal Arterial | 2.0 | 4.4 | 1.9 | 0.4 | 3.2 | 0.4 | 12.4 | |||
Total Length (mi.) | 5.8 | 16.2 | 23.0 | 9.2 | 4.0 | 3.2 | 2.5 | 2.4 | 0.5 | 66.9 |
Figure 15 shows the methodology recommended changes to the speed limit and Table 6 documents the length of the segments by recommended change. Along the HRN, no increases to speed limits are recommended. Of the miles of roads evaluated for which speed data was available, approximately half (30 miles) are not suggested for changes in speed limit. The most common recommended change is a 5 mph reduction, which applies to 20.7 miles of the network evaluated. Less than 8 miles are suggested for increases in the speed limit; however, based on a city policy decision, speed limits are not planned to be raised on any segments at this time.
Category | Suggested Change in Speed Limit (mph) | |||||
---|---|---|---|---|---|---|
-10 | -5 | 0 | 5 | 10 | Total Length (mi.) | |
High Risk Network (HRN) | 1.6 | 11.5 | 5.8 | 0.0 | 0.0 | 18.9 |
Not on HRN | 1.5 | 9.2 | 24.2 | 6.6 | 0.8 | 42.4 |
Total Length (mi.) | 3.2 | 20.7 | 30.0 | 6.6 | 0.8 | 61.4 |
The project team will continue to work on validate the results of the methodology and refine the results through engineering judgement. City staff continues to work on the implementation plan and signing recommendations. In accordance with the timeline of the 2023-2027 Vision Zero Action Plan, speed limit changes are expected to be fully implemented across the transportation system by 2027. Given the magnitude of anticipated changes across the system, it is likely a phased implementation will be needed to ensure the following:
An implementation report should be prepared for each of the street segments that addresses the following:
Streets in Boulder are classified as local, collector, minor arterial and principal arterial. This map highlights the collector, minor arterial, and principal arterial streets.
A chart shows the distribution of speed limits by street classification. All local streets have a speed limit of 20 mph, unless otherwise posted. For collectors, 58% are 25 mph, 32% are 30 mph, 7% are 35 mph, and 3% are 40 mph. For minor arterials, 8% are 20 mph, 8% are 25 mph, 25% are 30 mph, 39% are 35 mph, 16% are 40 mph, and 4% are 45 mph. For principal arterials, 2% are 25 mph, 19% are 30 mph, 41% are 35 mph, 32% are 40 mph, and 6% are 45 mph.
This map shows categories of existing zoning classifications – downtown, residential/mixed-use/public, business, and industrial/agricultural. The speed limit setting methodology takes into consideration these existing land-uses on either side of the Street. Residential/mixed use/public land-use covers approximately 78% of Boulder’s land area, concentrated in south, west, and north Boulder. The business land use covers 5% of Boulder’s land area and is concentrated in central Boulder and Gunbarrel. Industrial/agricultural makes up 16% of city land area and occurring in east and north Boulder and Gunbarrel. Finally, the downtown zoning classification occurs least often, making up 1% of Boulder’s land area in the downtown area.
A chart shows the percent of land area covered by each zoning classification and the percent of street segments in those categories analyzed in the project. Business zoning makes up 5% of city land area. 5% of the street segments analyzed in this project are in business areas. Downtown zoning makes up 1% of city land area. 3% of street segments analyzed are in downtown areas. Industrial/agricultural zoning makes up 16% of city land area. 23% of street segments analyzed are in industrial/agricultural areas. Residential/mixed-use zoning makes up 78% of city land area. 69% of street segments analyzed are in residential/mixed-use areas.
This map shows the street segments evaluated in this study, categorized by their surrounding land use. There are 12 street segments in the business land use, 10 in downtown, 28 in industrial/agricultural, and 87 in residential/mixed use/public.
Industrial/Agricultural:
This flow chart shows the methodology in 5 layers. The first layer of evaluation is identifying if the segment is part of the existing High-Risk Network (HRN). The HRN, developed as part of the 2023-2027 Vision Zero Action Plan, represents just 7% of city streets but accounts for 48% of serious- and fatal-injury crashes in the city. Within the methodology, street segments in the HRN are set to default to lower speeds by recommending to the rounded-down 50th-percentile speed. This priority step aligns with the city’s Vision Zero commitment, streamlines the process by eliminating Subsequent layers of analysis, and aligns with the Safer Speeds aspect of the Safe Systems Approach.
The second layer of evaluation is a point system that quantifies the need for lower speeds. Points were awarded to locations based on 16 factors. Each factor is given a point, ranging from 1-15, depending on its priority in determining the appropriate posted speed limit. For example, a segment with a crash resulting in a fatality is given 15 points, while presence of a park within ¼ mile of the segment is given 2 points. Thirty-five percent of the available points are allocated to crash related factors, thirty-five percent to multimodal use and facility factors, twenty-four percent to road configuration factors, and six percent by the presence of trip generators factors. This step reinforces the data-driven approach of the methodology and defines Boulder specific thresholds for all 16 factors. The assigned points determine the associated tier for the segment, with Tier I being 55-100 points, Tier 2 being 34-54 points, and Tier 3 being 0-33 points.
The third layer of the evaluation is an output table, where the functional classification, the land use, and the point system evaluation play a role in determining the observed speed percentile that should govern the speed limit setting. The possible outputs of the methodology are closest 85th percentile (C85), rounded-down 85th percentile (RD85), closest 50th percentile (C50), and rounded down 50th percentile (RD50). (E.g. if the 50th percentile speed is 33 mph, then the C50 output would be 35 mph, while the RD50 output would be 30 mph, etc.).
The fourth layer is the Speed Limit Table which establishes ranges of appropriate speeds for each land use and functional classification group. The table is also a policy defining piece of the methodology, where the city is able to define target speeds irrespective of the observed operational speeds of the corridor. Whenever the operating speeds in a segment falls outside the speed range shown in the Speed Limit Table, the values in the table will dictate the speed limit methodology’s recommendation for the segment.
The fifth and final layer is to apply engineering judgement to ensure that the final recommendation is context-sensitive, financially and technically feasible, and meets the expectation of the community. City staff will review the corridor, its surrounding areas, and the speed recommended by the methodology to validate and refine the results as needed. Special attention will be given to corridors near the city limits where roads transition from Boulder’s jurisdiction to County roads and consistency on the posted speed limit is expected. Segments with recommended changes greater than 5 miles per hour will be manually reviewed as well. Long corridors will also be checked to ensure consistency on the posted speed limits, ensuring that the posted signs do not unnecessarily change without significant changes on the road context. While city staff understand and respect the methodology used to develop recommended speed limits on evaluated segments, as part of its unwavering commitment to Vision Zero, the city is not planning to raise any posted speed limits at this time. Engineering judgment will be applied to segments with recommended speed limit reductions to ensure consistency, credibility, and enforceability. The proposed Boulder speed limit setting methodology not only incorporates city-specific parameters but also establishes a precedent to determine policies that extend beyond the operating speeds.
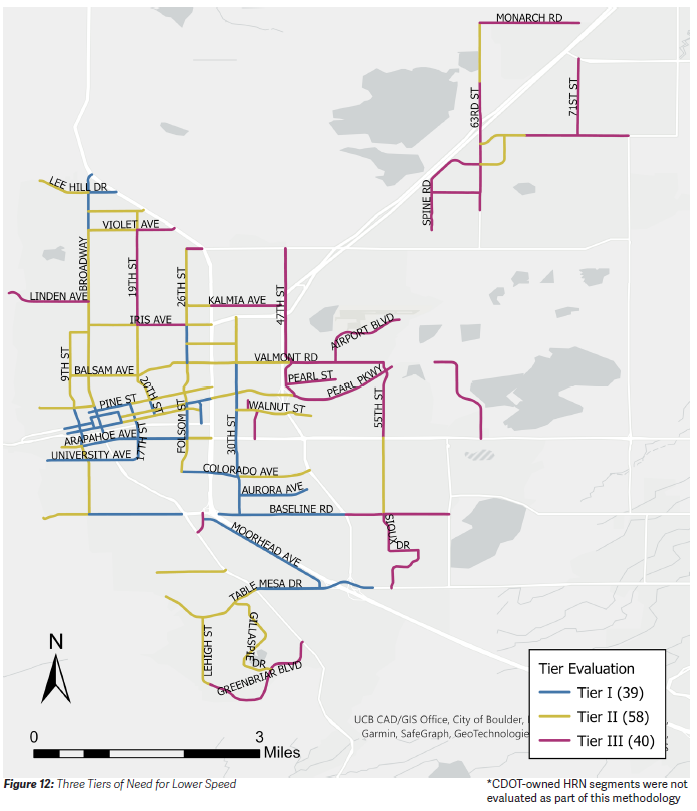
This map shows the evaluated street segments categorized into three tiers of need for lower speeds. The tiers were calculated using a 16-factor point system. Tier 1 consists of 39 street segments, Tier 2 of 58 segments, and Tier 3 of 40 segments.
This map shows the recommended speed limits for the evaluated Street segments. There are 17 street segments recommended at 20 mph, 36 street segments recommended at 25 mph, 40 street segments recommended at 30 mph, 15 street segments recommended at 35 mph, 7 street segments recommended at 40 mph, and 7 street segments recommended at 45 mph.
For the street segments that did not have any available speed data, the methodology suggested the output speeds that were recommended based on the data that was available. The final speeds are not listed but the suggested output is as described.
This map shows the difference in the recommended speed limits compared to the existing speed limits for the evaluated street segments. 8 streets segments have a recommended decrease of 10 mph, 41 have a recommended decrease of 5 mph, and 59 have no recommended change. 12 street segments were recommended for an increase of 5 mph and 2 were recommended for an increase of 10 mph. While city staff understand and respect the methodology used to develop recommended speed limits on evaluated segments, as part of its unwavering commitment to Vision Zero, the city is not planning to raise any posted speed limits at this time.
*While city staff understand and respect the methodology used to develop recommended speed limits on evaluated segments, as part of its unwavering commitment to Vision Zero, the city is not planning to raise any posted speed limits at this time.