A consumption-based emissions inventory (CBEI) is an estimate of the greenhouse gas emissions associated with the activity of all residents of a geographic area. It is equivalent to a personal household carbon footprint estimate, except calculated for all households in a jurisdiction.

How is this different?

CBEIs differ from traditional geographic-based greenhouse gas inventories. Traditional inventories factor in all emissions that occur within a city's borders. In contrast, CBEIs consider emissions that may occur anywhere in the world that directly or indirectly result from the activities of a city’s residents.

Geographic and consumption-based approaches are complementary and partially overlapping. Both will look at residents’ local, direct emissions (e.g., from driving or home heating). A geographic inventory will also consider the emissions from local businesses and visitors but ignore anything outside the city’s boundaries. Meanwhile, a consumption-based inventory will omit the local emissions from businesses and visitors, but instead account for emissions associated with residents’ travel to other cities, as well as the emissions associated with producing the goods and services they purchase or consume. Those consumption-based emissions may occur anywhere in the world.
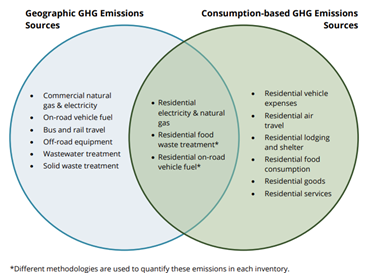
Greenhouse Gas Emissions Comparison Chart

These consumption estimates are developed using a model that primarily considers six key household variables:

  • household size (people per household)
  • household income
  • vehicle ownership (cars per household)
  • home size (rooms per home)
  • education (bachelor's degree or higher for at least one member of the household)
  • homeownership

These variables often have clear, direct effects on consumption. For instance, larger homes generally take more energy to heat or cool, while more people per household means more food consumed per household.

In collaboration with Boulder County, citywide consumption-based emissions were analyzed by EcoDataLab. The city's CBEI report is a first of its kind report for Boulder. The CBEI looks at emissions that occur anywhere in the world, as a result of Boulder community members’ activities. It includes emissions not previously measured from categories such as food, goods and services, and underscores the importance of addressing our upstream emissions.

A More Honest Picture

Though the methodology behind this CBEI is different from other city emissions inventories, there’s a great deal of overlap between the two.

The CBEI revealed that in 2021, the typical Boulder household was responsible for roughly 38 metric tons of CO2e annually (MTCO2e), or about 17.5 MTCO2e per person. With 42,376 households in the city, this is a total of roughly 1.6 million MTCO2e in 2021 attributable to residents of Boulder.

When compared with the city’s traditional Community GHG Inventory, which shows a total carbon footprint of 1.4 million MTCO2e citywide, the CBEI helps broaden the picture of emissions attributable to Boulder residents. For the first time, data is available for the emissions categories of food, goods and services.

Transportation, food and services are the largest overall categories, accounting for 31%, 20% and 19% of emissions, respectively. Together, these account for almost 70% of total emissions. Within sub-categories, gasoline, healthcare and electricity are the top three, accounting for 21%, 10% and 7% of total emissions, respectively – almost 40% combined.

Transportation

The transportation category includes gasoline usage, vehicle purchases and maintenance, and air travel. For an average household in Boulder, transportation accounts for 11.8 MTCO2e per year, per household. Much of this comes from gasoline, which accounts for 8.2 MTCO2e, or 69% of the total transportation emissions.

Housing

Household energy use, home construction and maintenance, water and waste make up the Housing category. Overall, a typical Boulder household has 7 MTCO2e resulting from housing, with the largest single category being electricity. Electricity produces 2.8 MTCO2e, or 40% of the total housing emissions.

Food

The Food category includes all food consumed by Boulder residents, broken down by meat, dairy, fruits and vegetables, and other foods consumed at home, as well as eating out. Food accounts for 7.5 MTCO2e, and the single largest subcategory is meats, poultry, fish and eggs at 1.8 MTCO2e, or 24% of total food emissions.

Globally, roughly 24% of greenhouse gas emissions are a result of agriculture, forestry and other land use changes, with most of these emissions resulting from agriculture. In the US, agriculture resulted in roughly 623 million MTCO2e in 2019, or about 10% of national emissions (according to the US EPA's most recent national inventory12).

Goods

Goods includes all physical items purchased by households (excluding items in other categories, like food and fuel). Goods includes things like furniture, personal electronics, clothing, toys and books. These goods account for 4.8 MTCO2e per household per year. Of these goods, furnishings and appliances is the single largest source, making up 2.2 MTCO2e, or 45%, of total goods.

Generally, goods have lower emissions per dollar than food or energy. Households with higher incomes tend to spend more money (as well as a greater fraction of their income) on goods and services. Homeowners also tend to spend more on home furnishings and equipment.

Services

Services includes the emissions associated with offerings such as healthcare, education, insurance and finance, and entertainment experiences like concerts and museums. Services account for 7.1 MTCO2e per household, and the single largest category is healthcare at 4 MTCO2e, or 56%.

Healthcare dominates emissions from services primarily because it is a large economic sector. Nationally, healthcare makes up roughly 18% of the US economy; in Boulder, healthcare emissions are about 10% of the average household's carbon footprint. Healthcare emissions include emissions from the construction and operation of hospitals, doctor’s offices, and other medical facilities; manufacturing of pharmaceuticals and medical equipment; and more.

Everything we buy contains embodied emissions, the greenhouse gas emissions produced by the creation and shipment of goods.

Our vision is to build a more circular local economy that keeps materials out of landfills and in use as much as possible. This growing area of work moves beyond recycling and composting to focus on preventing waste and pollution in the first place. It also explores innovative ways to curb Boulder’s collective consumption through reuse and repair.

Learn more about the city’s Circular Boulder Vision.

The chart below provides an overview of the city's average per-household emissions in 2021. The actual emissions of any household, however, could vary significantly from this average. Differences in household size, spending, housing, travel and other factors will affect each household's emissions.

Community Consumption-based Greenhouse Gas Emissions Dashboard