Project Overview
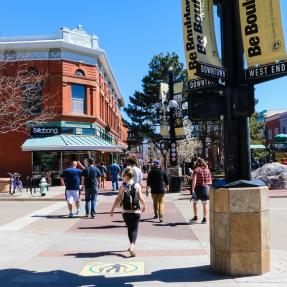
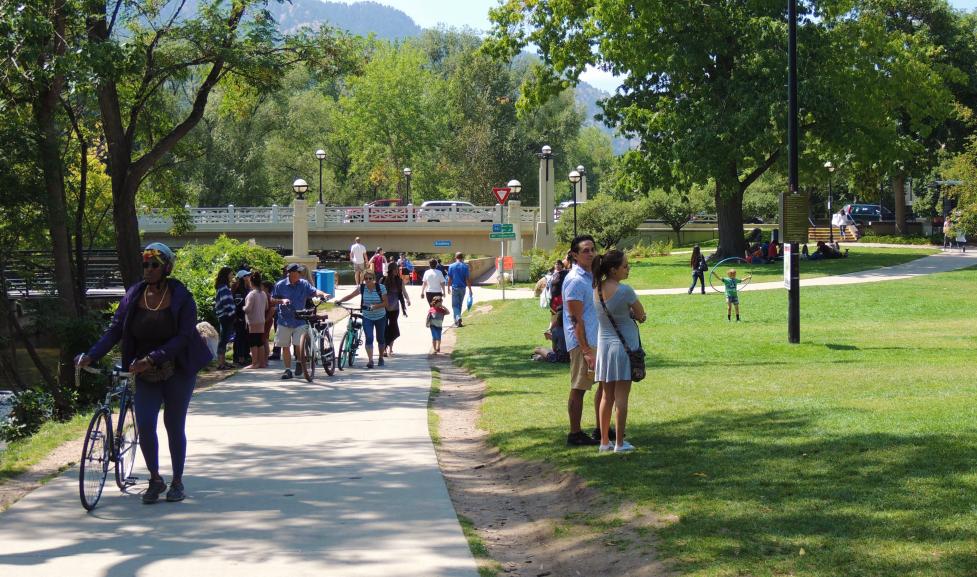
A connected walking and bicycling network provides a safe and comfortable transportation experience, enabling people of all ages and abilities to get where they want to go by foot or bike.
A connected walking and bicycling network provides a safe and comfortable transportation experience, enabling people of all ages and abilities to get where they want to go by foot or bike.
When people get in a car, they rarely give much thought to whether the road can get them to their destination or if they feel secure taking children with them.
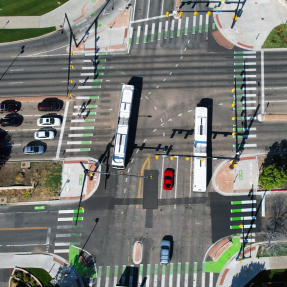
By contrast, getting on a bike or walking often entails crossing busy streets and mixing with vehicular traffic, which can create barriers for people who aren’t familiar with the system or don’t feel comfortable in a busy street environment.
To address these issues, the City of Boulder conducted a study to evaluate the level of traffic stress within the city’s existing bicycle and walking network.
The goal of the Low-Stress Walk and Bike Network Plan is to attract a broader population of people (ages 8 to 80) as confident and comfortable pedestrians and bicyclists.
Recommendations include proposed multimodal routes, wayfinding to connect existing routes and specific projects needed to create a complete network.
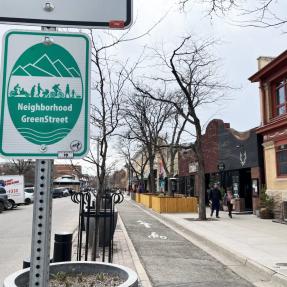
Neighborhood GreenStreets are an important part of the city's Low-Stress Walk and Bike Network Plan. These are streets with low vehicle volumes and speeds that are prioritized for bicycle and pedestrian travel. They feature improvements that increase comfort and safety for pedestrians and bicyclists of all ages and ability levels
The following tools and strategies, ranging from direct community feedback to quantitative data analysis, were used to collect information needed for the analysis phase of the Low-Stress Walk and Bike Network Plan.
As part of the People for Bikes' City Snapshot program, the City of Boulder used a fine-tuned network connectivity tool using Open Street Maps that considers current roadway conditions (for example, speed limits, traffic volume, presence and type of bicycle facilities and likely origins and destinations). This static mapping exercise assessed the level of traffic stress for Boulder’s bicycling network. The BNA relies on data from two sources: The U.S. Census and OpenStreetMap (OSM). The resulting level of traffic stress map was tested using several qualitative inputs to ensure accuracy and to determine if any patterns emerge.
Strava is a mobile application that is typically to record travel times, routes, elevation gain and calories burned for both recreational and commuter rides. The State of Colorado acquired access to Strava Metro data, which they are making available free to all municipalities and advocacy organizations in Colorado. This data helps us better understand commuter routes, preferred routes, origins and destinations and wait times for bicyclists at intersections.
Using the City of Boulder's engagement platform Be Heard Boulder, over 1100 comments about walking and biking were collected between March and May 2018 using an interactive map. The community was able to drop a pin on the map of Boulder and let us know where walking and biking in the city is great and where it could use some improvement.
The City of Boulder collects close call reports through the city’s web-based reporting platform, called Inquire Boulder. Staff has tracked hundreds of reported close calls between 2015 and 2017 and have mapped each location. This data was used as another means of determining potential patterns in the transit network. A direct link between level of traffic stress and close calls has been identified through recent research and may attribute to the likelihood of whether one chooses to bike or walk for transportation. Staff also took into account the Safe Streets report’s collision analysis and mitigation strategies.
Over time, the City of Boulder has installed numerous bicycle counters as part of individual projects, and while some of the counters are contemporary and provide an easily accessible interface to monitor and analyze data, many of the counters have not been functioning or have significant gaps in the data records. Part of this project was be to review all existing counter locations, retrieve current data from older counters, update counter technology, and potentially install new equipment. This project component took place throughout the duration of the study.
Throughout 2018, staff collected data and conducted community outreach. In the first half of 2019, staff identified and prioritized projects. The Low-Stress Walk and Bike Network Plan was finalized in late summer 2019 with the release of the 2019 Transportation Master Plan.
The City of Boulder is committed to digital accessibility. Some content may not be fully accessible due to technical limitations or issues. For alternate formats or accommodations, please visit Accessibility | City of Boulder or contact accessibility@bouldercolorado.gov.