Project Overview
The Vision Zero Innovation Program adds innovative, quick-build projects to city streets to reduce vehicle speeds and improve safety and comfort for people walking and biking.
The Vision Zero Innovation Program adds innovative, quick-build projects to city streets to reduce vehicle speeds and improve safety and comfort for people walking and biking.
The city has developed specific recommendations to keep, modify or remove each project after reviewing them by:
Evaluating before and after speed and traffic volume data
Periodic field observations
Reviewing maintenance records and feedback from maintenance staff regarding snow/icec removal
Reviewing feedback from the City of Boulder Fire Department
Reviewing over 300 community responses public feedback submitted to staff via email, phone and an online form
The City of Boulder is committed to digital accessibility. Some content may not be fully accessible due to technical limitations or issues. For alternate formats or accommodations, please visit Accessibility | City of Boulder or contact accessibility@bouldercolorado.gov.
Over 350 community responses during public engagement from 2021 to 2022 helped inform the city's recommendations. Click the tabs below for details and a summary of recommendations for keeping, modifying or removing each project. Projects recommended for removal were removed in spring 2023.
Remove
Staff will maintain project until Safe Routes to School project replaces paint and posts with concrete curb extensions.
Keep
Staff will maintain project indefinitely.
Keep
Staff will maintain project indefinitely.
Keep
Staff will maintain project indefinitely.
Remove
Staff removed the project in Spring 2023. The project will remain on the Neighborhood Speed Management Program Complex Project List.
Modify
Staff will consider relocating delineators at corners and adding bike dots for cyclist navigation.
Modify
Staff will consider relocating delineators at corners and adding bike dots for cyclist navigation.
Keep
Staff will maintain project indefinitely.
Remove
Staff will remove project by Spring 2023. The project will remain on the Neighborhood Speed Management Program Complex Project List.
Remove
Staff will remove project by Spring 2023. The project will remain on the Neighborhood Speed Management Program Complex Project List.
Remove
Staff will remove project by Spring 2023. The project will remain on the Neighborhood Speed Management Program Complex Project List.
Keep
Staff will maintain project indefinitely and will consider snow removal on the north side of the street (Boulder County)
Undergoing Re-evaluation
Staff will maintain project indefinitely and consider adding bike dots for cyclist navigation.
Modify to a pinch point
Staff will the yellow median delineators in chicane between white islands. 19th Street curb extensions will be replaced with the permanent 19th Street project.
Staff modified the two islands in the chicane to a pinch point, similar in design to the two pinch points further west. Flexible posts were placed to provide space for people walking and biking through the pinch point to travel separately from vehicles. The 19th Street curb extensions were replaced with the permanent 19th Street project.
Keep
Curb extensions improve visibility of crossing pedestrians.
Staff will maintain project indefinitely.
Keep
Staff will maintain installation indefinitely.
Keep
Staff will maintain project indefinitely.
Keep
Staff will maintain project indefinitely.
Keep
Staff will maintain project indefinitely and will consider making a more permanent project with planned work for the Core Arterial Network.
Keep
Staff will maintain project indefinitely.
Modify
Staff will consider snowplow clearance modifications.
The projects were installed through the city’s Vision Zero Innovation Program to help reduce vehicle speeds. These projects have been used effectively in cities around the world and are new to Boulder.
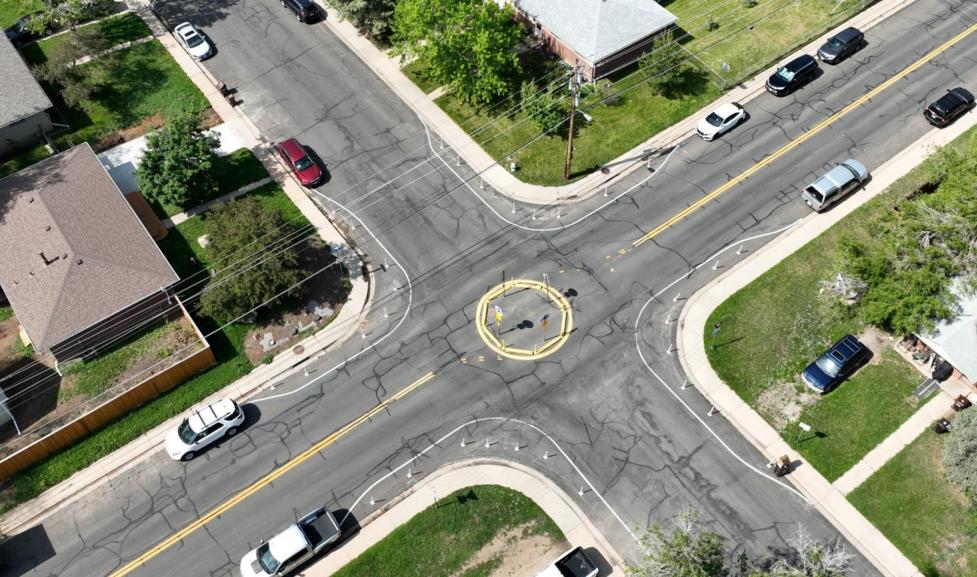
Their purpose is to encourage slower vehicle speeds by physically narrowing the street. The designs are intended to cause drivers and other road users to slow down and pay attention to their surroundings, which creates safer street environments for people walking and bicycling. On some streets, the posts also extend the curb and/or create a median island, which provides safer crossings for pedestrians and bicyclists.
The types of projects the city uses have been designed according to National Association of City Transportation Officials (NACTO) standards and follow industry best practices for speed mitigation.
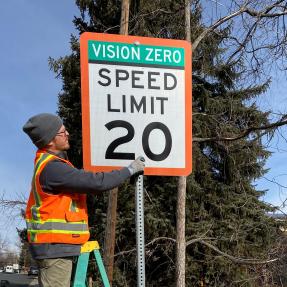
The projects have been installed because they change the street design in ways that can help reduce speeding. Speeding is one of the top causes of severe traffic crashes in Boulder, and reducing speeding requires two approaches: lowering the residential speed limit to 20 mph, which the city did last year, and changing the street design itself.
Both of these approaches are standard practice for Vision Zero cities. Vision Zero is a commitment adopted by Boulder and cities worldwide to eliminate fatalities and serious injuries caused by traffic crashes – zero serious injuries, zero deaths on our streets. Since the City of Boulder committed to our Vision Zero goal in 2014, we’ve adopted policies and built projects to make our streets safer.
The Vision Zero Innovation Program was identified as a way to mitigate speed mitigation on city streets at a lower cost and on a much faster timeline than typical transportation projects. Finding agile and low-cost ways to create safer streets in Boulder is critical to achieving Vision Zero, especially as the COVID-19 pandemic has reduced the city’s budget for transportation projects.
The City of Boulder reviewed the effectiveness of VZIP projects by evaluating:
Before and after speed and traffic volume data
Periodical site visits
Maintenance records and feedback from maintenance staff regarding snow/ice
Feedback from the City of Boulder Fire Department
Community feedback submitted to staff via email, phone and an online form
Community feedback is a key part of VZIP. Since the program launched in 2020, the city collects feedback on how safe and comfortable people feel when using these projects and includes community input in evaluations for changes.
Staff will continue to monitor the effectiveness of VZIP projects over time.
The projects have been installed in locations where the city and/or nearby residents have identified a need for safer street conditions. Some of the locations are those where the city has observed speeding or dangerous driving. Others are locations where nearby residents submitted a petition to the city to receive speed mitigation measures on their streets, through the city’s Neighborhood Speed Management Program. The designs of the projects built also took into account community feedback received during the first year of the Vision Zero Innovation Program (2020), including feedback gathered through virtual neighborhood forums.
Travel slowly around the posts, looking out for all road users. Vehicles always travel around the posts. Bicyclists can travel with traffic or through the posts. Pedestrians can stay on the inside of the posts and travel between them to cross the street.
Streets: Project designs allow enough space for snow removal on city streets. Staff will be monitoring the projects throughout the snow season for any adjustments to plowing streets.
Curb Ramps and Extensions: When it snows, city property owners, managers and tenants are required to clear sidewalks adjacent to their property, including a 5’ path on curb ramps and extensions, within 24 hours after snow stops falling. View the municipal code about clearing snow off sidewalks.
Because of the Vision Zero Innovation Program, designed to create safer streets in our community, clearing your sidewalk may look a bit different this year if your property is next to a new curb extension, which creates more room for pedestrians and cyclists and helps to slow down turning vehicles. This extension, whether built with concrete or with paint and flexible plastic posts, is considered part of the sidewalk and must be cleared when it snows.
These designs were chosen because they are noticeable to drivers, low-cost and quick to install. Staff will address maintenance needs and refresh the pavement as needed.
The purpose of VZIP is to provide transportation improvements that slow vehicle speeds and provide enhanced protection for people walking and biking more quickly and for less money than traditional projects that use concrete and asphalt. For that reason, speed humps/cushions are not an option under the VZIP, which focuses primarily on paint and post projects.
VZIP uses three main project types, all of which can be made quickly and at a lower cost while improving pedestrian and bicyclist safety and comfort:
The Transportation and Mobility Department dedicated $250,000 of its Vision Zero funding in 2020 to the Vision Zero Innovation Program (VZIP). VZIP uses cost-effective, quick-build projects intended to accelerate progress toward creating safer streets to help achieve our community’s Vision Zero goal of eliminating fatalities and serious injuries caused by severe traffic crashes.
The city's 2019 Low-Stress Walk and Bike Network Plan, which identifies high-risk locations for walking and bicycling in Boulder, is used to help identify locations for VZIP projects. Community feedback, data evaluation and the 2019 Safe Streets Report also help inform locations.
Before and after installation, the city collects data and community feedback to evaluate each project's effectiveness.
*Primary image photo credit: Mural: GNEURAL / Photo: Ryan Policky / Latenight Weeknight