Boulder Valley Comprehensive Plan | Community Context and Local Trends
Community Context and Local Trends
Big-picture trends about Boulder Valley community members – those who live, work and visit the area – and how these patterns change over time provide context for the plan. These conditions help explain why planning for the future matters and what challenges and opportunities Boulder Valley may face over the next 20 years. Understanding where Boulder is today is essential to making thoughtful choices about where the community wants to go next.
To guide the policies and future land use strategy that shape the Boulder Valley’s growth over the next 20 years, the comprehensive plan relies on population and employment projections from the Colorado State Demography Office. Several scenarios were provided by the State Demographer to understand a range of possible outcomes based on historic trends. The population projection is based on the City of Boulder maintaining its share of the total population within Boulder County and the employment projection is based on the city maintaining its proportion of the total jobs within the State of Colorado.
People and Demographics
Most people in the Boulder Valley live in the City of Boulder, which functions as a college town with a large population of young adults, a place with high-paying jobs and high quality of life attractive to professionals and families and as a community where many residents are approaching retirement and wish to age in place. This demographic creates a wide range of needs for housing, transportation choices and mobility, healthcare access, services and public spaces for people in different phases of life.
About 121,000 people live in the Boulder Valley today, including about 106,900 in the City of Boulder.
Young adults ages 18–29 make up about 41% of the city’s population, largely due to the University of Colorado.
About 16% of community members are age 60 or older and this group is growing.
About 12% of community members are age 18 or younger and this group is shrinking.
The Colorado State Demography Office projects the city’s population could reach about 118,800 people in the year 2045.
While the student population of CU is expected to keep Boulder’s population relatively young, the growing proportion of older adults highlights a need to adapt services, housing and infrastructure to support residents at all stages of life. Additionally, the school-age population is declining across the nation and this trend is pronounced in Boulder. Enrollment in the Boulder Valley School District has decreased significantly since 2017, particularly in the elementary grades. Fewer children living in the community affects neighborhood vitality, public school funding and facilities and long-term community sustainability.
Housing
Local Housing
Housing plays a central role in who can live in Boulder, how far people commute and whether the community can support its workforce.
There are about 58,000 homes in the Boulder Valley, with roughly 53,000 located in the city’s Service Area (Areas 1 and 2).
Housing types include single-unit detached homes, duplexes, townhomes, apartments, condominiums, manufactured homes and accessory dwelling units.
About half of all homes are apartments or condominiums, while around 40% are single-unit detached homes. This mix is similar to other peer cities with universities.
47% of homes in the city are owner occupied and 53% are renter-occupied. The proportion of for-rent homes is higher than the state average of about 34%.
New Housing
Since 2015, most of the new housing built in the city has been apartments and condominiums. An average of about 370 homes have been built each year over the past decade. Development has been concentrated near downtown, Boulder Junction, CU Boulder and parts of east, north and south Boulder.
Housing Cost
Housing prices have risen significantly over the past decade. In 2025, the median price of single-family homes sold in the city was about $1.28 million, a 70% increase since 2015. Local rents have also gone up, but have moderated and started to fall in the last few years. The median home rent in the city is around $2,000 per month. This is higher than the median for the county (about $1,900) and the median for the state (about $1,700).
Affordable Housing
There are over 4,300 permanently affordable homes in the city. That makes up 8.9% of the total housing available and serves about 9,500 residents. Since 2000, the city has added, on average, 127 permanently affordable homes annually. From 2000 to 2014 about 40% of those homes were affordable homeownership and around 60% were affordable rental homes, serving low, moderate and middle income households. Since 2015, that proportion has shifted to about 5% affordable homeownership and 95% affordable rental homes annually.
Rising housing costs and limited housing choices are closely linked with cost of living in Boulder and shaping who can live here. The high cost is affecting local commuting patterns into and out of the city and county, as well as local spending and economics. Planning for distributed, diverse housing options and a range of price points can influence many outcomes, including transportation and the economy.
Transportation
How People Travel
Travel choices shape daily life, safety and the community’s climate impact. People use a variety of ways to move around the community, including driving, bicycling, using the bus, walking and rolling. When looking at the main forms of transportation and travel patterns, there has been a shift over time.
Single-occupant vehicle (SOV) travel for all trips by Boulder residents has declined over time. 35% of all trips by residents are in an SOV.
Transit ridership is recovering but remains below pre-COVID levels. Transit service cuts have not been fully restored, fewer employers opt to provide EcoPass transit passes to employees and increased teleworking remain factors impacting ridership.
18% of Boulder resident trips are on bicycles or scooters, with 4% of these trips on an e-bike or e-scooter.
More jobs in Boulder are held by nonresident employees than resident employees and both groups continue to travel differently. An estimated 77% of non-resident employees use single occupancy vehicles to get to their jobs in Boulder. Resident employees have better access to multimodal options and take more multimodal trips to get to work compared to non-residents.
Non-resident employees travel over 18 miles on average to reach jobs in Boulder.
While the behavior of city residents has become less dependent on driving alone over time, Boulder’s role as a regional job center continues to draw workers to the community by car. Changing work patterns, accessibility of mobility options and availability of local housing will continue to influence how people move to and through the Boulder Valley.
Employment and Business
Boulder’s economy is innovative and diverse, supported by major institutions such as the University of Colorado and a broad range of businesses, including a high concentration in advanced technology industries. The area serves as a major employment hub along the Front Range with more jobs than working-age residents. Having businesses in a wide variety of industries helps make the local economy more resilient.
Boulder has a broad range of businesses, including a high concentration in advanced technology industries, and serves as a major employment hub along the Front Range with more jobs than working-age residents. Having businesses in a wide variety of industries helps make the local economy more resilient. toward remote and hybrid work and impact foot traffic, street activity and commercial area vitality.
About 95,000 jobs and 8,000 employers are located in the City of Boulder.
Most businesses are small, and 90% of the city’s employers have fewer than 20 employees.
Only 1.5% of the city’s employers have 100 or more employees; however, they provide 46% of jobs in the city.
The Colorado State Demography Office projects the city’s employment could reach about 123,000 jobs in the year 2045.
The Colorado State Demography Office projects the city’s employment could reach about 123,000 jobs in the year 2045.
Job growth over the past decade has been modest, an average less than 0.5% per year over the past decade. Job gains were concentrated in professional, technical and manufacturing sectors. Over the past few years, retail, entertainment and food services businesses have seen losses or uneven recovery due to several factors including changing buying habits and impacts of the COVID-19 pandemic.
Climate Change and Natural Hazards
The Boulder Valley is experiencing climate change right now. Recent climate trends in Colorado include longer periods of hot and dry weather and precipitation uncertainty. Hotter and drier weather means that vegetation is more prone to wildfires. Uncertain precipitation projections reflect the potential for unexpected, intense rain events.
Since 2000, streamflows in the South Platte River basin dropped 18% compared to a 1951-2000 baseline.
In the Colorado River basin, streamflows have dropped 5%. While supplies go down, the demand for water in these basins has increased.
The changing climate and increasing natural hazard risks have serious implications for community safety, health and wellness. Planning for response and recovery while working towards reducing risks will help the community adapt to the changing conditions. Meanwhile, national changes in environmental regulation and funding for programs that manage pollution of air and water, greenhouse gas emissions and the use of protected public lands could impact local efforts to adapt to climate change and manage natural resources. To stay true to Boulder’s environmental values and climate action goals, the community may have to build greater strength in local and regional partnerships.
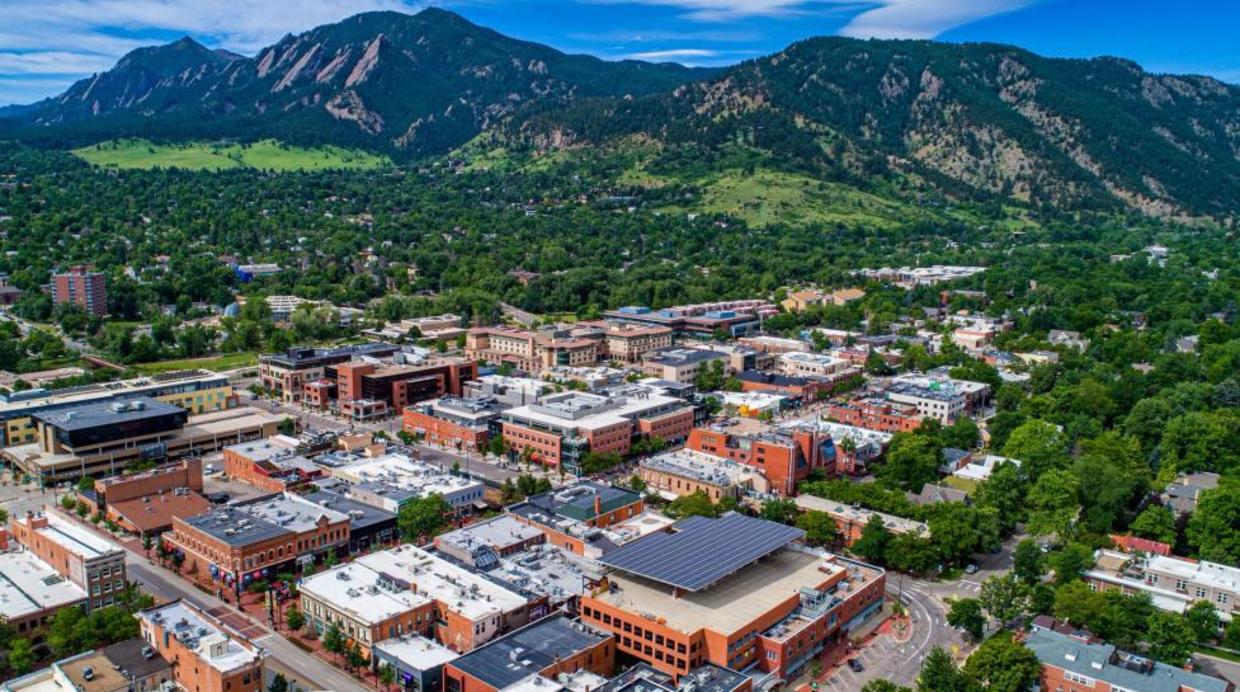
A bird’s eye view of downtown Boulder looking toward the Flatirons illustrates how the city and county work together to encourage a compact city surrounded by natural and rural lands.
Planning Together in the Boulder Valley
Boulder’s natural beauty, sitting against a mountain backdrop, highlighted by the Flatirons and foothills to the west, with open space and rural lands extending to the east, north and south is one of its defining features.
While the Boulder Valley has undoubtedly changed over the years, the persistence of this form, a compact city framed by rural lands, did not happen by chance. The City of Boulder and Boulder County have worked together for decades to preserve open space in the Boulder Valley and focus urban growth within defined areas. Coordinated planning, shared policies and long-term investments in land conservation have shaped a community where development is concentrated and the various functions of the surrounding rural lands are protected.
This pattern of a compact city surrounded by natural and rural areas helps define Boulder’s strong sense of place, preserves agricultural lands and sustains habitats and biodiversity. Neighborhoods, commercial areas and the University of Colorado campus are connected to both farms and foothills and anchored by greenways and urban parks throughout the city. This results in a community where urban daily life is closely linked to access to the natural environment and rural activities and character are maintained, without the pressure of potential urbanization. Community members in both the city and surrounding county areas value this urban and rural distinction, and this continues to guide many planning decisions today.